Assignment 2: Quadratics
Varying Coefficients
Here's a graph of a
quadratic equation


What happens if we adjust the
 term?
term?
The following graph the
adds the quadratic equation
 :
:

Blue:  ,
Purple:
What changed from to
to
 ?
?
How did that change affect the graph?
The general form of
the equations shown above is

We can have all sorts of combinations
of a, b, & c:
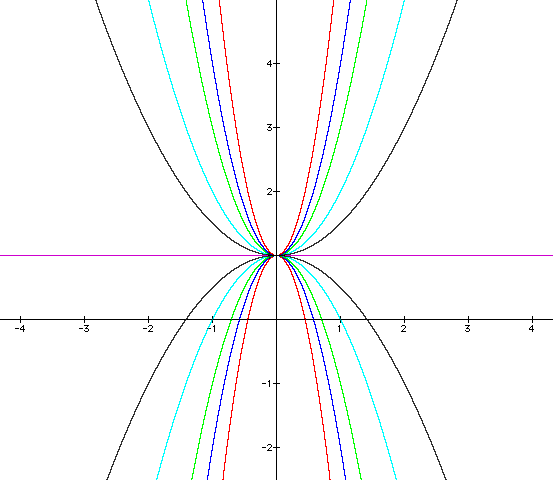
The graph below shows
various values for a, where b = 1
and c = 1;
That is, a changes while b and c
are both fixed.
{Note: In each of these cases, a is a POSITIVE value}

Values for a
Light Blue: 0.5; Purple: 1; Blue: 2; Red: 3
How does changing the
coefficient a seem to affect the behavior of
the graph?
What happens when a
is a Negative value?
The equations graphed
below all have negative a values.
Is that what you expected?
How does a negative
value for a change the graph?

Values for a
Light Blue: -0.5; Purple: -1; Blue: -2; Red: -3
What happens when a
= 0?
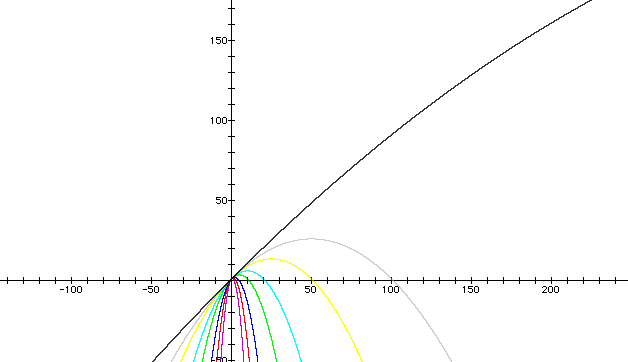
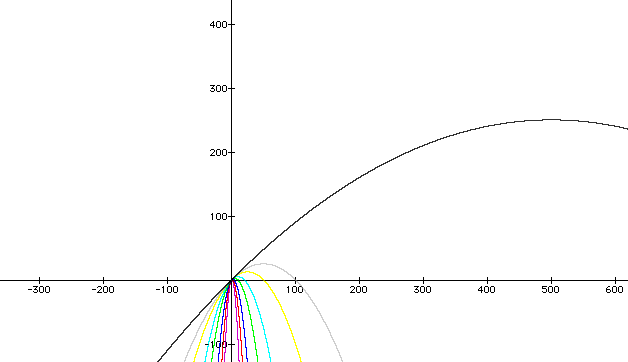
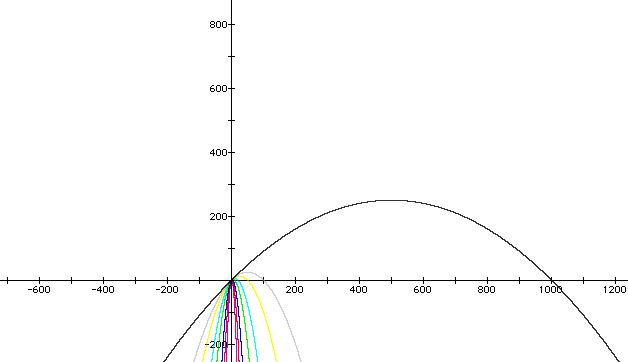
Here is a graph that shows various
negative values of a that get closer and closer
to zero.
How are the graphs changing?
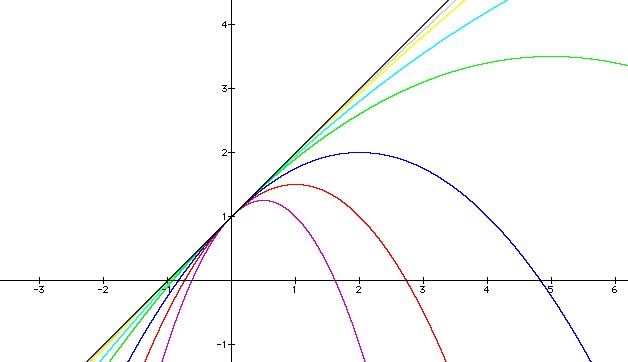
Are you sure?
What if we zoom out some?
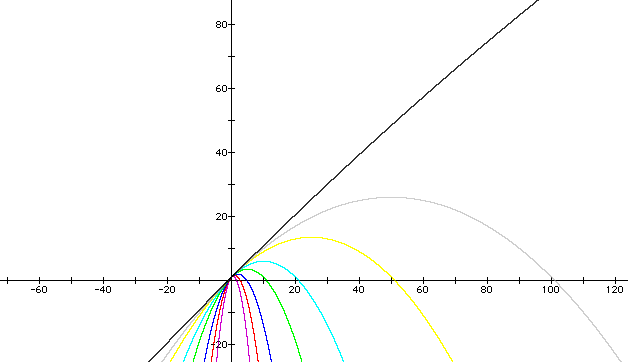
How about if we zoom even further?
More still?
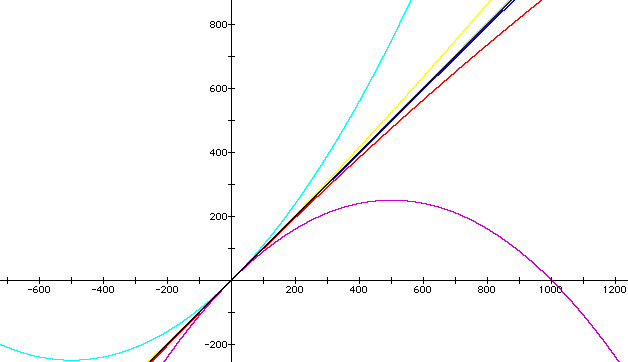
This graph shows values of a
getting closer and closer to zero from both the positive and negative
side.
Let's zoom back in, this time.
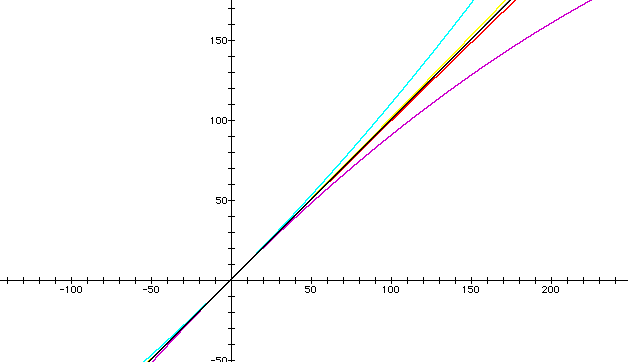
And again.
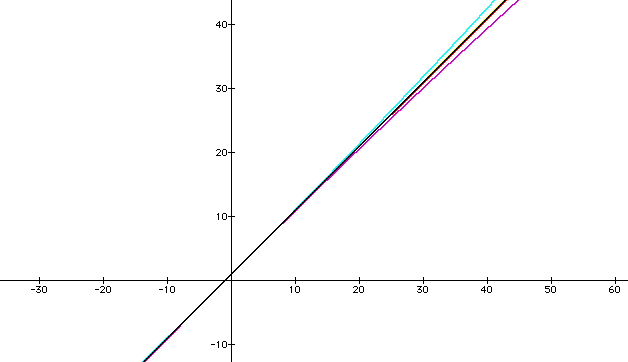
As a goes to zero, what can you
say about the behavior of the quadratic equation

Changing
a
Can you characterize how changing
a changes the graph?
Changing
b
What happens when we
adjust the b value?
Remember, we are looking at the
general equation:

The graph below shows various
positive values of b
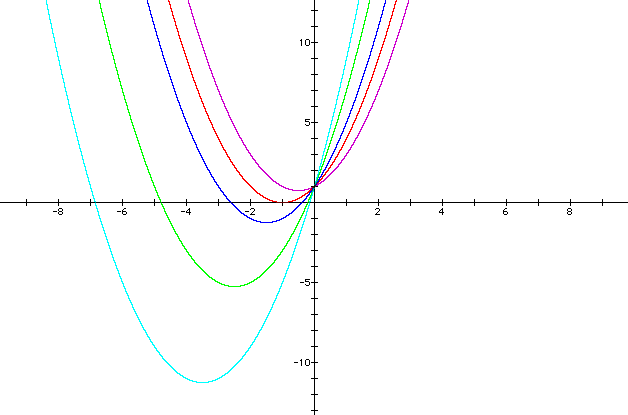
Values for b
Purple: 1; Red: 2; Blue: 3; Green: 5; Light Blue - 7
What do you think will
happen when we vary negative values of b?
Can you characterize how changing
b changes the graph?
Changing
c
What affect will adjusting
c, the "constant", have?
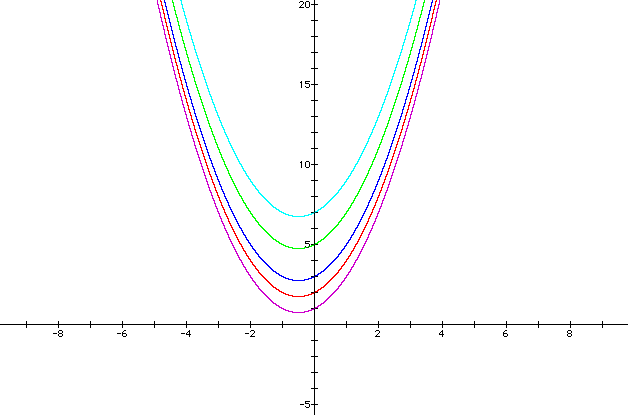
Values for c
Purple: 1; Red: 2; Blue: 3; Green: 5; Light Blue - 7
What affect will negative
values of c have on a graph?
Can you characterize how changing
c changes the graph?
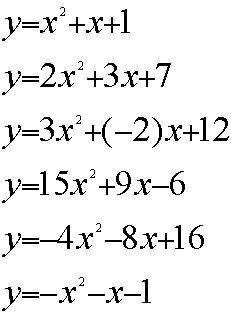
Ok. Take a look a the
graphs below. What can you determine about a, b,
& c?
What is changing? What causes the line with a negative slope?
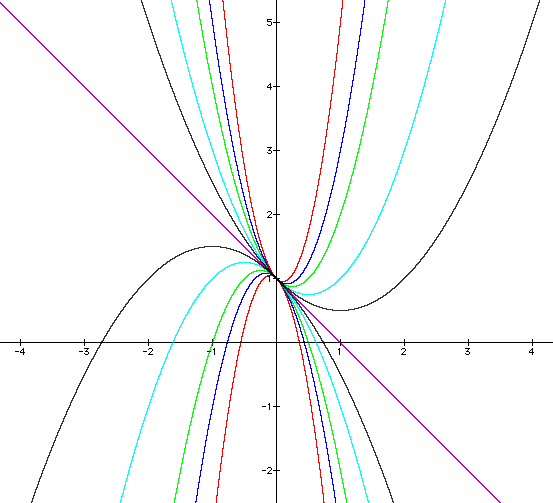
How about these? Can
you characterize a, b, & c?
