

Note: This write-up is best viewed with a screen resolution of 1280 X 1024 (or higher). If viewing this page in a smaller resolution, please note that for the pairs of graphs below, when the text refers to the "left" graph, that is the "top" graph of the two graphs paired together that display one above the other in your browser. Likewise, the "right" graph and the "bottom" graph are the same.
Let's examine the equation:
For most applications other than ones such as Graphing Calculator, this equation would be difficult to graph. Most would require the user to first solve for y, and then input that equation. However, if we can first re-write this in parametric form we can graph this equation in most applications, including graphing calculators such as the TI-81 or TI-82.
We can accomplish this by first letting y = tx cross the curve at (0, 0) and at (x, y). Then, substituting, we have
This results in the following parametric equations:


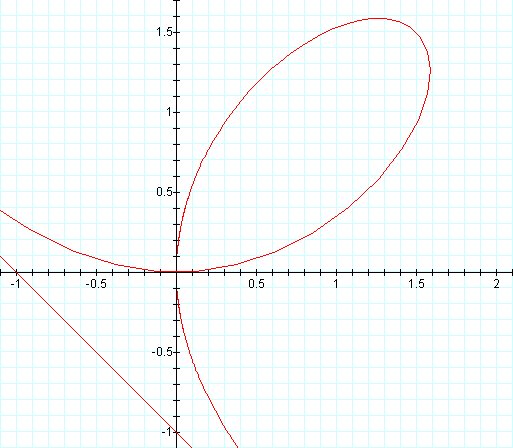
Now we must find a suitable range for t. Since we are able to graph our original equation with Graphing Calculator, let's compare the graph of the original equation to graphs of the parametric equation to gain insight into what range to use for t. For each of the comparisons, we have the graph of the original equation on the left and the graph of the parametric equation on the right.
We begin with t in the range
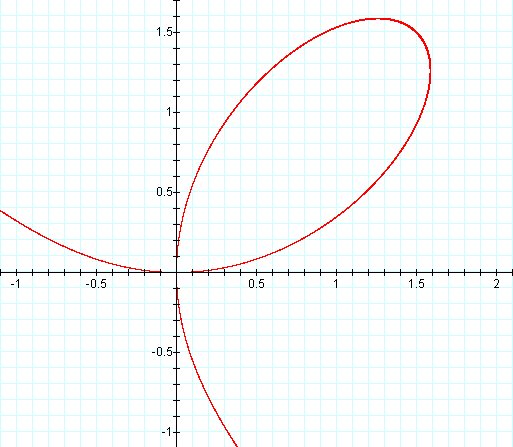
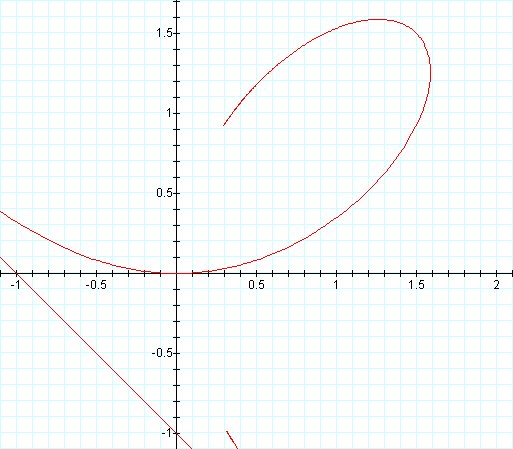
Obviously our range of t is not large enough. In addition to noticing that we do not obtain the entire graph for this range, we see that when graphing the parametric equation we get an asymptotic line in the graph. Also note that the parametric graph shows the curve as complete on the interval [-.1, .1] on the X-axis.
Next we graph with t in the range

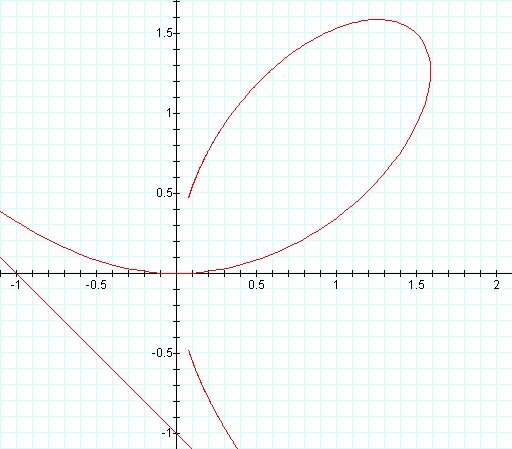
We obtain more of curve for this range. Now let's try t in the range

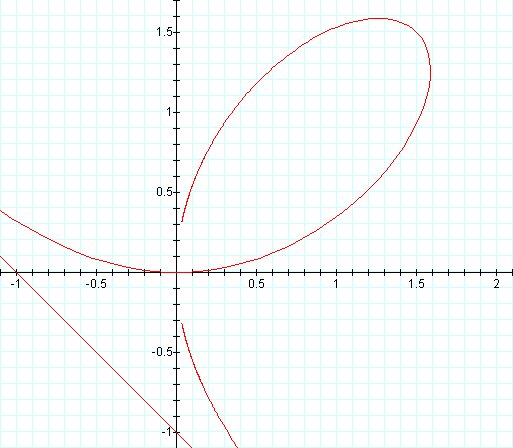
Getting closer, but still not the whole curve. Try t in the range

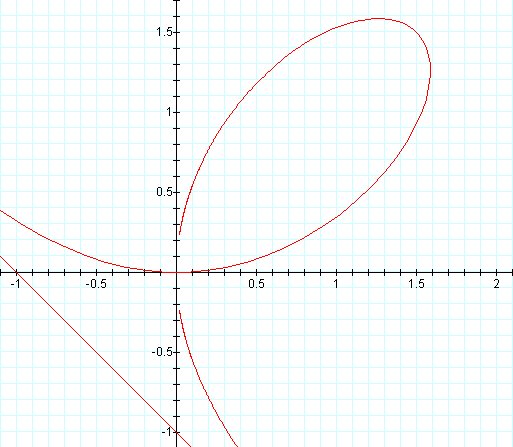
Almost. Now graph with t in the range

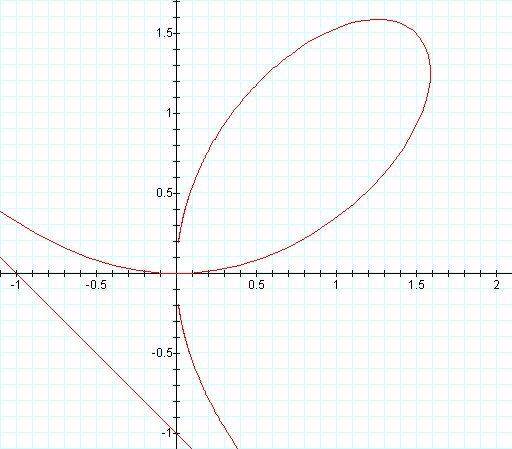
Still a little short. Further tries will show that with t in the range

| Return to main page. |