

Problem: Investigate the following parametric curves as t varies between 0 and 2 pi:


etc. Investigate for a =b, a < b, and a > b.
Investigation/ Exploration of Problem:
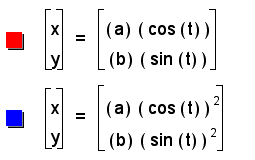
A parametric curve is a pair of functions that defines an ordered pair. The functions are continuous functions of parameter t. The range of the parameter t greatly affects the function. The parameter t explains what occurs as the function varies with time t or with the angle of rotation t. parametric equations represent the x, y coordinate pairs as follows:
x = r cos (t)
y = r sin (t)
Where:
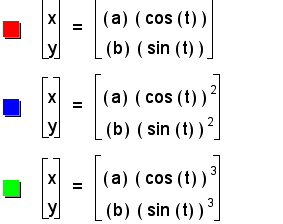
To begin this exploration I began by graphing the basic parametric curve:
for a = b = 1. I let the range of t be 0 to 2 pi inclusive.
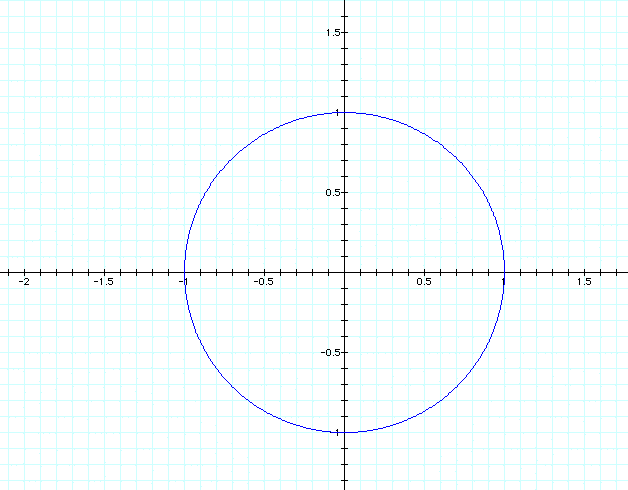
Note that this appears to be the graph of the unit circle. Notice that in this case:
Also notice that:
is the unit circle. Look at the following formula:
This is a trigonometric identity and also forms the unit circle.
So the parametric equations:
![]()
corresponds to the unit circle.
If I let a be larger than b, note that I will then have an ellipse with the major axis being the horizontal axis in this case. In this particular case I let a = 2 and b = 1.
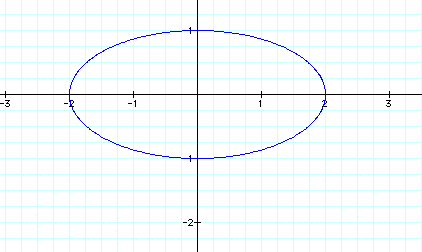
Notice that when a = 2 the ellipse goes out to 2 on the major axis and one on the minor axis where b = 1.
Notice that the equation of an ellipse in cartesian coordinates is:

It appears that as a changes the parametric equations:
![]()
correspond to the Cartesian equation of an ellipse.
Notice that if a is smaller than b the vertical axis becomes the major axis of the ellipse and the horizontal axis becomes the minor axis of my ellipse. Here is the graph:

In this case a = .5 and b = 1
Now, as I move onto the parametric curve:
![]()
as t ranges from 0 to 2 pi, when a and b are set equal, both at one I obtain the following graph:

Notice that this graph seems to make sense because the sine and cosine graphs have a range from 0 to 1.
This graph appears to be a line segment. This line segment is a portion of the line:
![]()
in Cartesian coordinates.
Notice if I solve for rectangular coordinates I obtain the following equation:
![]()
Notice also that this is a chord of the circle constructed by the parametric equations when a and b are both set equal to one:
![]()
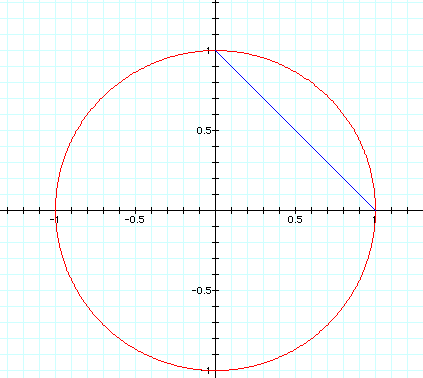
Notice that if I make a table of t, x, and y for these equations I obtain:
| t | x | y |
| 0 | 1 | 0 |
| pi/4 | 0.5 | 0.5 |
| pi/6 | 0.75 | 0.25 |
| pi/3 | 0.25 | 0.75 |
| pi/2 | 0 | 1 |
| 2pi/3 | 0.25 | 0.75 |
| 5pi/6 | 0.75 | 0.25 |
| pi | 1 | 0 |
| 5pi/4 | 0.5 | 0.5 |
| 4pi/3 | 0.25 | 0.75 |
| 3pi/2 | 0 | 1 |
| 5pi/3 | 0.25 | 0.75 |
| 2pi | 1 | 0 |
Notice that since the sine and cosine functions are squared in this case there are only positive values for the graph. Therefore the graph is only in quadrant one. This will occur every time the cosine and sine functions are raised to an even power unless a or b is negative. So, by noticing this I can conjecture that every time my parametric equations are raised to an odd power while a and b are positive, my graph will appear in all four quadrants and everytime my parametric equations are raised to an even power while a and b are positive numbers the graph will only appear in the first quadrant.
Notice for this graph as I make a larger than b, in this case I set a = 2 and b = 1 it again stretches the graph out along the horizontal axis. Here is a picture of this graph:

Notice that this line segment is a portion of the line:
![]()
It makes sense that increasing a would change the slope of the line as a portion of the line segment because slope in the cartesian plane is rise/ run. Since we are stretching the line segment along the horizontal axis, the change in slope for the cartesian coordinate must change in this fashion.
Notice that it makes sense that this would be a line segment and not the entire line since t is a parameter. x and y are only evaluated from 0 to 2 pi.
Now if I make a less than b, in this particular case I will make a= .5 and b =1. I obtain the following graph.
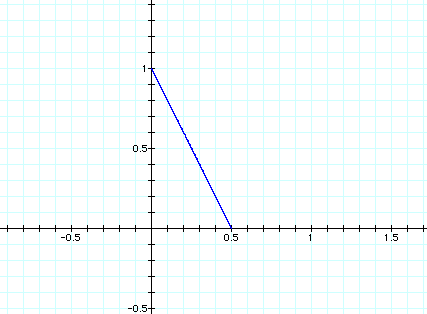
Notice that this squeezes the graph together.
This line segment is a portion of the following graph in the Cartesian Coordinate System:
![]()
Now, notice what happens as I move to the following set of parametric equations:

The graph looks as follows:
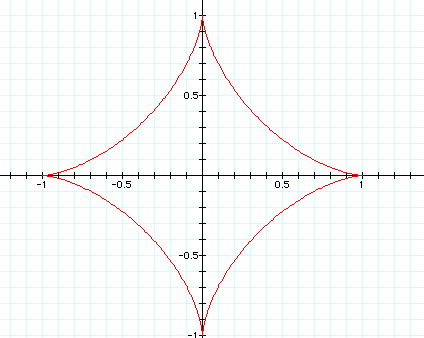
In this case I set a and b both equivalent to positive one. Notice however in this case if I changed a or b or both to be negative the same parametric curve results. This is because when the curves are raised to an odd power only the starting point of the graph changes in this case, however when a function is raised to an even power, the graph changes quadrants. This is because as t goes from 0 to 2 pi when raised to an even power, t maps out only positive coordinates x and y, so if a and b are changed the graph changes to be negative.
Now, notice if I change a so that it is larger than b, my graph again stretches out along the horizontal axis. Notice that this stretch along the horizontal axis always makes sense because the cos (0) = 1, and 1 raised to the third power is one. One multiplied by the factor of a, which is 2 becomes 2 and streches the graph out along the horizontal axis. When a is less than b, the graph squishes along the horizontal axis for the same reason.
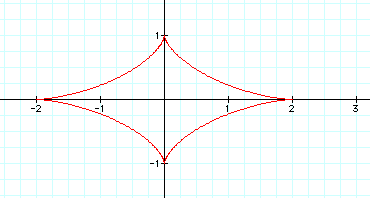
Notice that it goes to two along the horizontal axis, similar to what occured for the graph of the ellipse.
If I change my parameters so that a is less than b, in this case a = 0.5 and b =1, the graph looks as follows:
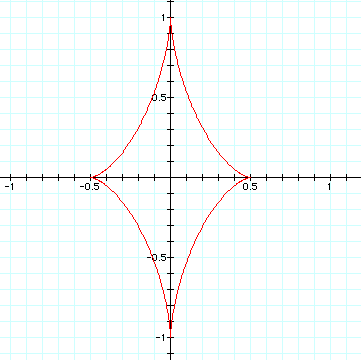
Notice that this again squishes the graph together on the horizontal axis. It also similar to the ellipse, in this case it appears as though the vertical axis is the major axis of this curve.
Notice that this family of parametric curves is symmetric whenever raised to an odd power.
Here is a graph of several of the parametric curves at once. Notice that as the parametric equations are raised to higher and higher powers the graph appears to head towards the horizontal and vertical axes. In these cases a and b are always equivalent to one.
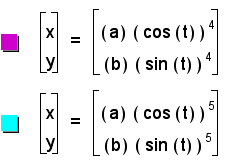
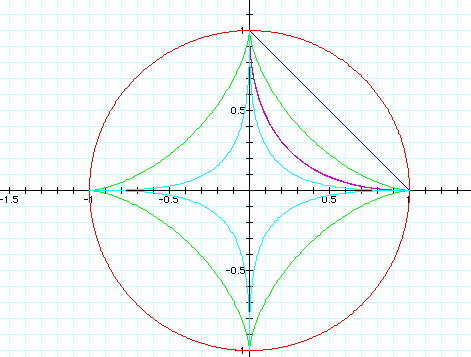
There is a very clear reason for this. As the cosine and sine are raised to higher and higher powers the graphs of the equations will get smaller the reason for this is that the range of the cosine and sine graphs is -1 to 1 when raised to an odd power and 0 to 1 when raised to an even power. This means that the two continuous functions will map out coordinates x and y whose values are in these ranges. When this occurs as the equation is raised to a higher and higher power the fractions will become smaller and smaller pushing the curve towards the horizontal and vertical axes.
Look at the following two parametric curves:

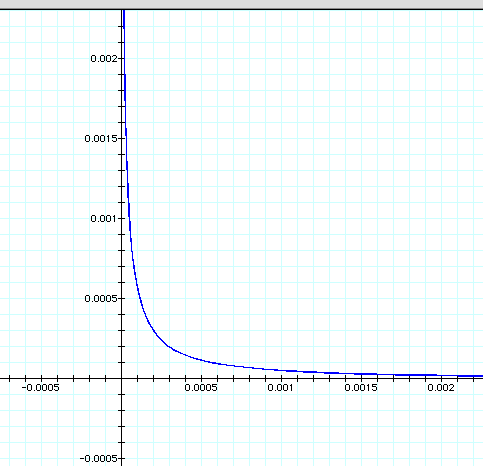
Notice how close the parametric curve is coming to 0.

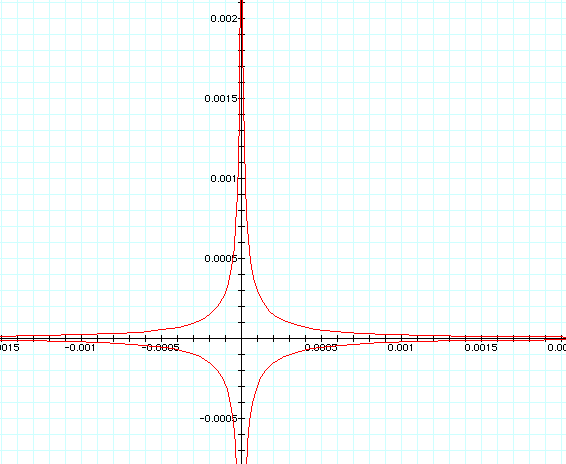
Note how this graph does the same thing.
Look at the graph of the following equation:


This graph gets closer an closer to 0.
Here is a gsp sketch that closely relates to the study of these parametric equations:
In this sketch I began by laying of a segment of any length and calling this segment AB. I took this segment AB to be the length of the radius of my circle.
I then constructed perpendicular lines. On these vertical of the perpendicular lines I constructed a point. I then drew a circle with this point as the center of my circle and the length of my constructed segment AB as the radius.
Next, I marked the intersections of my circle and the horizontal line of my perpendicular. Constructing the segments from the intersections to the point on the axis I obtain two segments of length AB. Know as I animate the point on my vertical line, up and down the vertical line, while tracing an envelope of the two segments of length AB I obtain the graph of an asteroid. If I take the midpoint of my two radii I will find that the graph is a circle. By taking various other points on the line I get the graph of an ellipse.
Click HERE to see this animation in gsp.
This graph shows that as the radius of one of my functions either:
x = a cos t
y = b sin t
represented by a or b, the graph of this function produces an ellipse whose major axis corresponds to the difference in length between a and b.
The circle is represented when a and b are exactly the same, or when the midpoint of the segment of length AB is traced.
Notice that in the graphs that we have just investigated the first parametric curve that looks like the representation of an asteroid is:

Notice that the asteroid is created by taking the envelope of the line segments. Notice also that the parametric curves which look like an asteroid are created by the odd powers, so that negative and positive values can be considered. If one continues graphing higher and higher odd powers of these parametric equations the graphs of what look like asteroids become closer and closer to 0. Now the envelope of the segments as an asteroid makes sense because as the radius is traced up and down the line it will come to a specific point where the radius of length AB and the distance from the x-axis to the origin and the distance from the vertical axes to the origin are exactly the same. As the point along vertical axis is animated so that the length of the segment from the x-axis to the origin is very small, the envelope of the line segments can no longer be straight and must be pushed out in the opposite direction in quadrants III an IV. The same thing happens as the animation is done and the distance from the origin to the point being animated on the y-axis becomes very, very samll.. Now, in terms of the parametric curve as the cos(t) and sin(t) become smaller and smaller the length of the radius from the origin to the x and y axes becomes smaller and smaller and must get closer and closer to 0 as the cosine and sine functions are made smaller and smaller creating the appearance of the asteroid that one can see in the gsp animation.
This is my investigation of parametric equations.
Author & Contact:
Jennifer Shea