

Title: Pedalogical Implications of Overlaying Graphs, Assignment #2
Problem Statement: When examining the graph
to determine how parameters a, b, and c change the graph of the function, what are the pedalogical implications of overlaying graphs one at a time as opposed to graphing everything all at once?
Problem Setup: What is most pedalogically advantageous to instruction, graphing several graphs at once or overlaying graphs one at a time?
Plans to Investigate/ Solve the Problem: I will begin by graphing several different graphs at once of
first varying a, then b, then c. Then I will overlay my graphs one at a time. I will determine through this process what I believe is most pedalogically advantageous to high school math students.
Investigation/ Exploration of the Problem:
Here are several graphs of
for a = 1, 2, 3, -1, -2, -3, 1/2, and -1/2, b and c in these cases will be fixed at one.
Click HERE to see graphs. One advantage of graphing several graphs at once are that this graphical representation shows the whole picture at once.
To me looking at all these graphs is slightly confusing if I instead only look at the basic graph first, I can see how the graphs move and predict how other graphs will move.
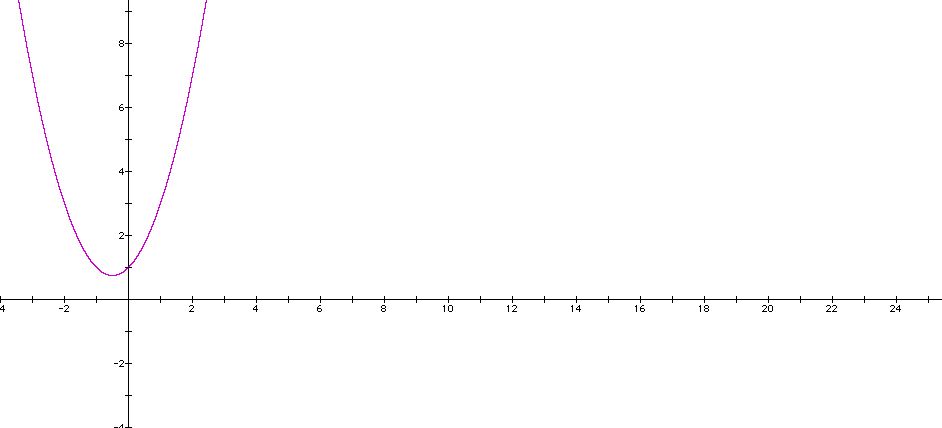
By adding one graph I can determine how this changes the position of the basic function in the last graph. I added the following graph, which is in blue.
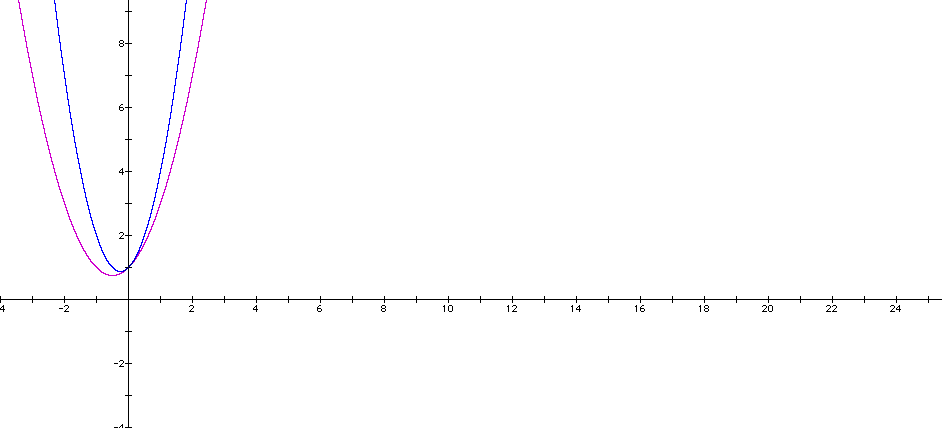
By looking at this graph I can note that it appears to change the graph by moving it up and to the right slightly. It also seems to smush the graph together some I wonder what would happen if I added the graph
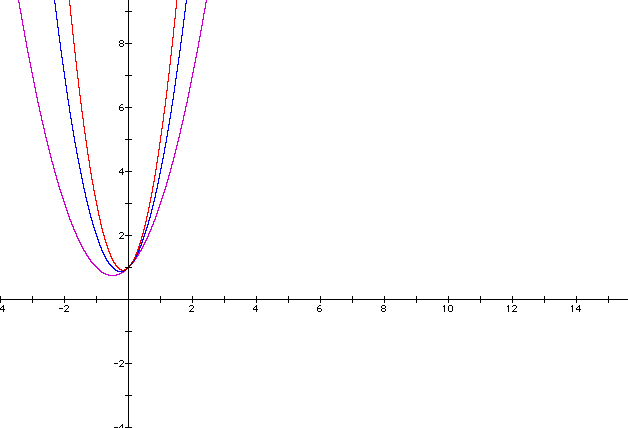
Ah, the same thing occured this time. I can now make a conjecture about what will happen to my graph if I let a=4. I can also examine what happens as a approaches 0 or as a goes negative. At this point I may want to begin asking myself what algebra may be involved in the determination of what these graphs look like. To examine what these graphs look like as a goes negative I will again begin with my basic graph

I will then overlay this graph with the graph

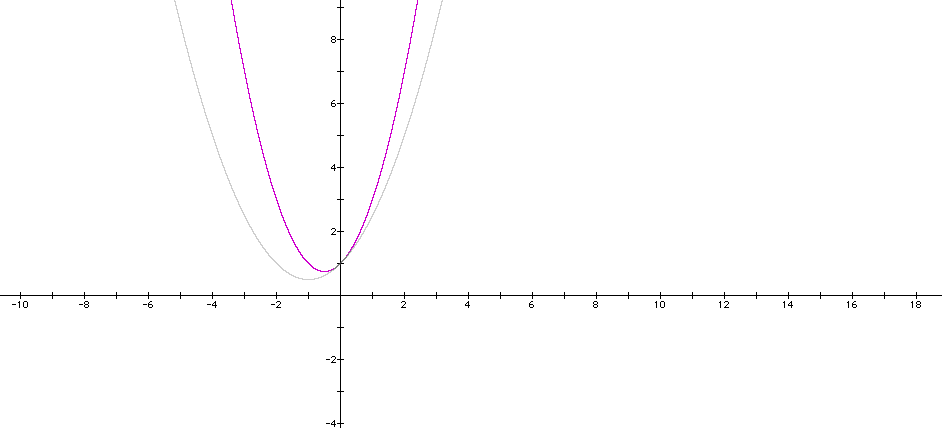
I notice that this time my graph is enlarged and pushed out. As a goes negative the same thing occurs, however this time it reflects across the x-axis.

Click HERE to see the graph as a changes from -5 to 5.
At this point since I know that this is a quadratic function I decided that I should look at the quadratic formula. These two parts of the quadratic formula provide one with the two real roots of the function.


I also decided that I needed to look carefully at the equation for a parabola. The equation for a parabola is:
I noticed from examining the quadratic formula and the equation of a parabola that the a in the equation of the parabola is the same as the a in the quadratic formula. I also determined that h and k represent the x and y coordinates of the vertex respectively with the h being equivalent to:

In the case of my basic equation:
If I solve for

I obtain :
since I know in the case of this equation that a = 1 and b =1.
I also decided to see how this is related to the derivative of the equation for the parabola. The derivative of :
with respect to x is equal to:
Notice that if I solve for :

I obtain -1/2. If I set y=0, and solve for x I obtain -1/2, which is equivalent to the vertex and to -b/2a. This derivative gives me the slope of the line that is tangent to the parabola.
Since the a is the same in the equation of a parabola I now know a and h of my equation which in standard form looks like the following:

I can easily solve for k by determining what k has to be in order for these two equations to be equal.

In this case:

Therefore I know that my equation in standard form must be:

Click HERE to view a graph which illustrates my point.
In addition to noting this about the parabola I was able to determine that the graph of the function smushes together the larger a becomes because in the equation:
As a gets larger it multiplies the :
term by a greater number. When this occurs the y will increase at a faster rate causing the parabola to become skinnier. In addition to making the parabola skinner as a gets larger, a moves the vertex of the parabola up, and as a goes towards 0 it moves the vertex of the parabola down. As a goes negative the graph opens down instead of up. One would expect this however because after one squares x and multiplies it by a negative number y will then be negative instead of positive. As a decreases negatively, it for example moves from -1 to -4 the vertex of the parabola (or the maximum value of the parabola) goes down. Here are several different values of a, and the vertex of the basic graph:
a=1, vertex = (-1/2, 3/4)
a=2, vertex =(-1/4, 7/8)
a=3, vertex=(-1/6, 11/12)
a=1/2, vertex =(-1, 1/2)
It is more instructive to now that we know how a changes the graph to show several graphs at once:

![]() (dark blue)
(dark blue)
![]() (light blue)
(light blue)
![]() (purple)
(purple)
![]() (green)
(green)
![]() (red)
(red)
![]() (yellow)
(yellow)
![]() (black)
(black)
I know understand a little bit more, why these graphs move the way they do.
I now begin an exploration to see how the parameter b affects the graph of the equation:
![]()
In this case I am varying b and fixing both a and c at 1.
I begin by graphing several of the graphs at once.
Here are several graphs of:
for several values of b.

I can see that changing b does affect the graph however it is difficult to see exactly how because of all the graphs which are displayed at once on this particular graph.
So, in this case I will again start with the basic graph:
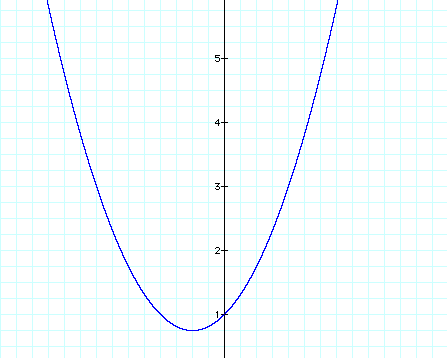
I am now going to graph both:

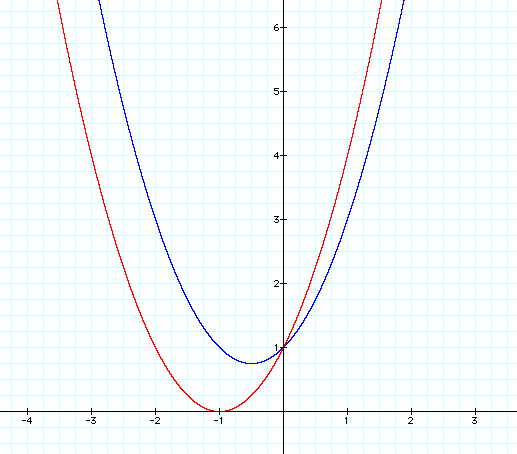
I notice from that:
moves the graph down and to the right. I hypothesized that setting b=3, would also move the graph down and to the left.
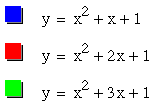
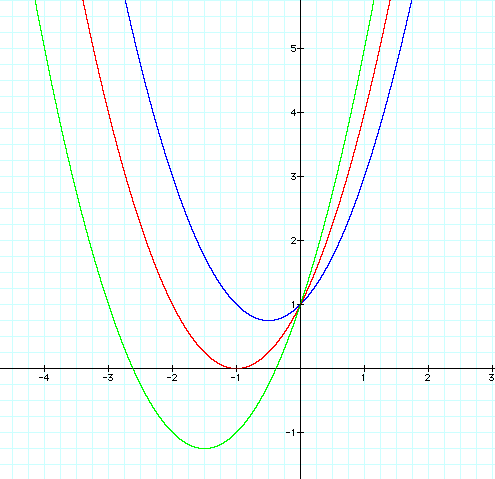
If I look back at to the quadratic formula again and investigate:

I noted before that -b/2a represents the x coordinate of the vertex of the parabola. Notice that as b gets larger the x-coordinate of the vertex of the parabola becomes more negative. If b=1 , the x-coordinate of the vertex is -1/2, if b=2 the x-coordinate of the vertex becomes -1, when b=3 the x-coordinate of the vertex of the parabola is -3/2. Because the x-coordinate of the vertex becomes more negative, the graph must necessairly move to the left. As b goes towards 0 and then negative I can hypothesize that the graph of the parabola will move to the right. For b =1/2, -1, -2, and -3, I can see that this is true.
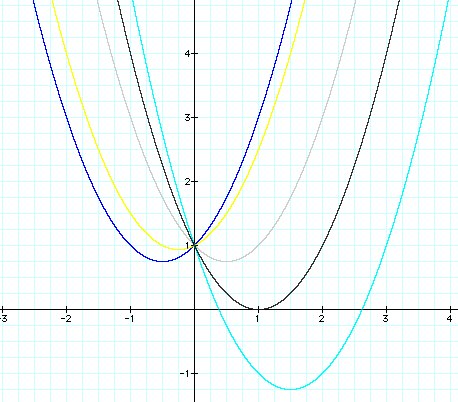
I also notice that if I vary the b values it seems to trace out what looks like a parabola.
Click HERE to see a demonstration of this for different values of b.
I was also wondering why the vertex of the parabola goes down as b goes large. Notice that if I look at the standard form of the equation:
As b goes large the h changes. And in order to find set the standard form of the equation equal to the given equation k must necessairly become smaller.
Let a=1, and b=1. Then:

is equal to:
Therefore, as noted previously h is also equivalent to:
as well. In order to solve for k, I then set the following two equations equal to each other:
![]()
and expand the second equation in order to solve for k I get that k=3/4
![]()
However, if I let b=3 and do the same thing, notice that k must necessarily become smaller. This is because the larger b is the larger h is. The c value in this case is remaining fixed at one. The larger h is the larger h squared will be, or the constant value in the expansion will be. In order for that value plus k to still be equal to one, k, which is the value of the y-coordinate of the vertex must become smaller.


Therefore in this case k must be equal to:
As you notice here, k does necessairly become smaller. Therefore the vertex of the parabola moves down.
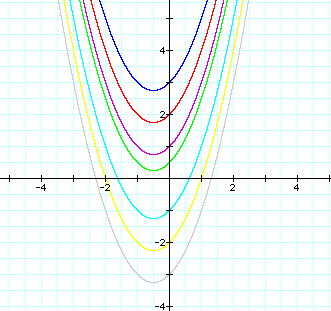
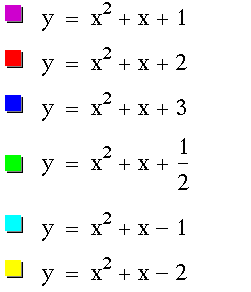
The next thing I did was graph several values of c for the basic equation:
![]()
It is necessary to see the big picture to evaluate at the end what occurs when the parameter c is varied. However it is hard to see what happens to c if you look at all of these graphs at once.
Alternatively with two graphs I can begin to conjecture about what will happen.

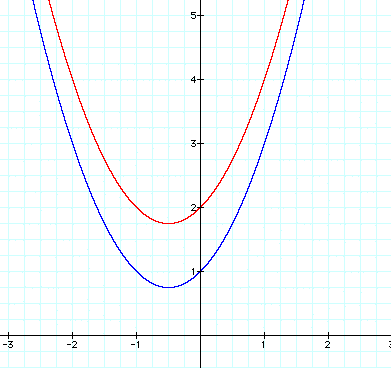
I would probably conjecture from this that as c changes the y-intercept of the parabola is equivalent to c. Notice if I graph the equation:
in addition to the other two this is certaintly the case.
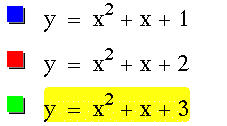
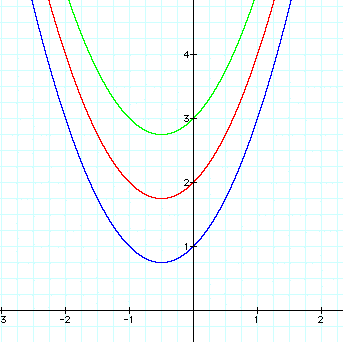
Now look at the graph of the parabola for several different values of c.

We can see that c, will move the graph up and down.
Extensions of the Problem: One could interview students to see what pedalogical methods they prefer. In addition, one can further investigate what the parabola curve is. I decided to further investigate the parabolic curve.
The parbolic curve is made up of a hyperbola and a line. Notice that if I look at the two following equations, one of a hyperbola and one of a straight line:

Notice that if I substitute my first equation into my second equation I obtain the following:

Now, multiplying both sides by x I will obtain:
Notice that if I subtract bx from both sides I obtain:
We have now obtained the equation of a parabola. If I look at the equation of the hyperbola and straight line that make the parabola I can determine whether or not the quadatic equation has any real roots.
For instance, the two equations which make up the quadratic equation:
are :

Notice that the graph of these two equations never meet:
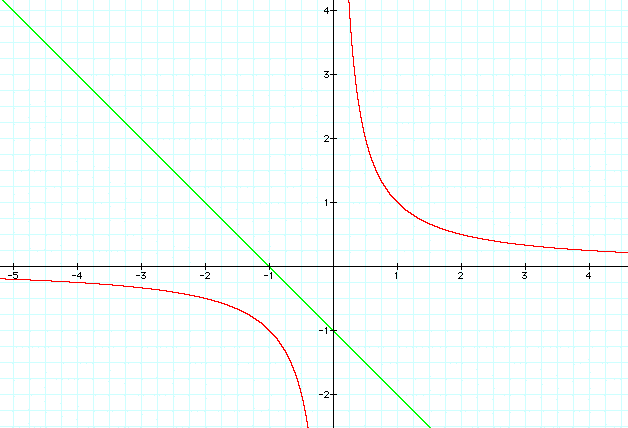
This indicates that the equation has no real roots, this can be confirmed by applying the quadratic formula.
In contrast, however, if I look at the graph of the hyperbola and straight line that make up the quadratic equation:
Which are:

When I graph these two equations I see that they meet at two points, therefore there are two real roots to this quadratic equation. This can again be confirmed by the quadratic formula.
Click HERE to see this graph.
Author & Contact: Jennifer Shea
Send me an e-mail
Links: