
The Spreadsheet
By Lauren Lee
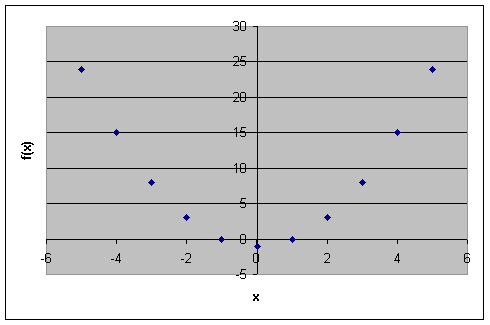
Construct a graph of any function y = f(x) by generating a table of values with the x values in one column and the y values in another.
I chose to graph the
function f(x) = x²-1.
I began by selecting values
of x and plugging them into my function.
|
x |
f(x) = x^2 - 1 |
|
-5 |
24 |
|
-4 |
15 |
|
-3 |
8 |
|
-2 |
3 |
|
-1 |
0 |
|
0 |
-1 |
|
1 |
0 |
|
2 |
3 |
|
3 |
8 |
|
4 |
15 |
|
5 |
24 |
Here is the graph that was
created from the table by Excel.
To view my Excel spreadsheet
click here.