
The Locus of Vertices for a Family of Parabolas
By
Kenneth E. Montgomery
Equation 1 is the standard form for the equation of a parabola.
Equation 1: ![]()
Holding a and c
constant (a = c = 1) we let b = n, for ![]() in
this GCF file which animates the parabola as n
varies between these values. This animation can also be viewed in movie format,
by opening this AVI file. The graphs of Equation 1
are overlaid in Figure 1, for {
in
this GCF file which animates the parabola as n
varies between these values. This animation can also be viewed in movie format,
by opening this AVI file. The graphs of Equation 1
are overlaid in Figure 1, for {![]() | -3 < b < 3}.
| -3 < b < 3}.

Figure 1: ![]() , with a = c = 1 and {
, with a = c = 1 and {![]() | -3 < b < 3}
| -3 < b < 3}
We
hypothesize from the animation and from the graphs in Figure 1 that the locus
created by the vertices of each parabola in the family of Equation 1, for ![]() is itself a parabola. If we overlay the plot of
Equation 2 (in black) onto Figure 1, we see that the locus indeed appears to be
this parabola (Figure 2). A general proof that the locus is the parabola of
Equation 2 is readily provided, using Calculus.
is itself a parabola. If we overlay the plot of
Equation 2 (in black) onto Figure 1, we see that the locus indeed appears to be
this parabola (Figure 2). A general proof that the locus is the parabola of
Equation 2 is readily provided, using Calculus.
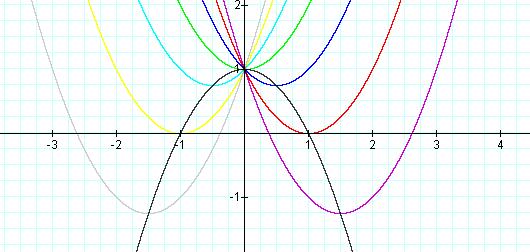
Figure 2: ![]() and
and ![]() , with a = c = 1 and
, with a = c = 1 and ![]()
Proof:
For ![]() let
let ![]() where
where![]() then
then ![]() For the slope of this equation, we have
For the slope of this equation, we have ![]() Setting this first derivative equal to zero
Setting this first derivative equal to zero
![]()
and solving for x, we have
![]()
This equation describes the x
coordinates of the locus of points. We wish to show that this locus forms a
parabola. Substituting back into the equation,
![]() with
with ![]() and
and![]()
we have
![]()
and squaring the first term yields
Simplifying the first term and
multiplying the second term by ![]() , gives
, gives
![]()
Combining like terms, we have
![]()
Multiplication of the first term by![]() yields
yields
![]()
Factoring the a, we have

Squaring the negative root yields
![]()
for which we then substitute x,
resulting in the desired parabolic equation
![]()
Ò
Return to Homepage