
Assignment 10
Parametric Equations
by Jeff Hall
Problem 1
Graph the following equation:

 Graphing the equation gives us this
circle of radius 1 centered on the origin:

Problem
2:
Investigate the equation for various
a and b constants in front of the t variables.
Let's explore other variations of this
equation.
What would happen if we multiplied
the first t by 2?

 It creates a parabola. Now let's multiply
the second t by 2:

 We go back to creating a circle. No
matter what constant is in front of
the t, as long as both parts have the
same constant, a circle will be created.
Now let's try different constants,
say a 3 in front of the first t
and a 2 in front of the second:

 One might have expected a parabola
again, but as you can see
we got someting quite different.
Problem
3
Investigate the following equation
for various a and b:
 Since we already know what the graph
looks like when a and b equal 1,
lets try a and b equal to 2:

 As might be expected, we have a circle
of radius 2 centered around the origin.
Will we have a parabola again if a=2
and b=1?

 No, this time we get an ellipse.
How about when a=1 and b=.5?

 We can now see a clear pattern. The
a variable determines the x-axis radius
while the b variable determines the
y-axis radius.
Problem 4
Graph the following equation:

 This creates the following graph.
 Notice that the circle is not complete
on the left side.
What can we do to fix it? Let's try
extending the range of t
from -2 pi to +2 pi. Here is the graph
now:
 The gap grew a little bit smaller.
Let's try t between -10 pi and +10 pi:
 We finally have a closed circle.
Why was the circle not closed before?
Your guess is as good as mine.
Now let's manipulate the equation to
find out how it works.
First, let's try changing the constant
in front of the first t variable, like so:
 This produces the following:
 The placement of 2 in front of the
t made the blue shape cross the x-axis at -2
instead of at -1 as before. But the
right side still crosses at x=1, so what should
we change to influence the right side
of the figure? Let's try changing the first 1 to a 2.

 It worked! By changing these two constants,
we have influenced
both horizontal sides of the figure.
But notice that the top and bottom parts
remained the same. The figure still
crosses the y-axis at 1 and -1.
How would we change that? Let's try
changing the constant in front of the t
in the y vector portion of the equation:

 It worked! This time, since there is
only one constant to change in the y vector,
the change from 2 to 3 changed the
vertical diameter of the figure from 1 to 1.5.
Problem 5
Graph several sets of curves for:
 Let me start by setting a and b equal
to 1 and changing k. Here's the first graph:

 Now let's change k from 1 to 2 and
zoom out a little bit:
 How about when k equals 5:
 How about when k equals zero?
 Finally, let's see what happens when
k=-2:
 It looks like changing the k value
influences the slope of the line,
but the a and b values influence the
starting point or common intercept.
Let's change a and b to see if this
is correct. Let's make a=2 and b=2.
We should expect the line to cross
(2,2). Let's make k=5 to make it easier to see:

 As expected, the a and b variables
determine where the line will cross, namely the point (a,b).
Problem
6
Graph the following:
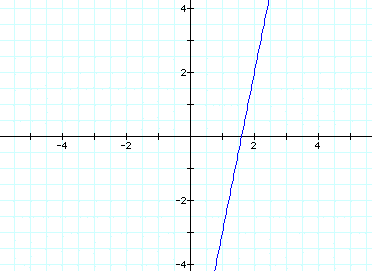
 I graphed the equation along t from
-2pi to +2pi to get this:
 What can we do to help us understand
this equation better?
Let's try changing the constants from
1 to 0:

 This changes the intercept point of
the line from (1,-1) to (0,0).
Also notice that the red line crosses
point (1, 2), meaning the slope is 2.
Changing the constants in front of
the t's should change the slope:

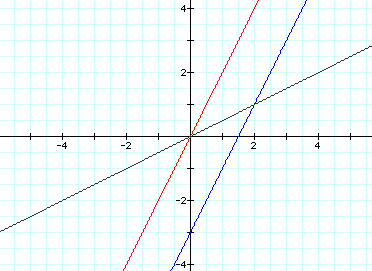 As we would expect, the slope changed
to 1/2 and crosses the point (2,1).
Problem 7
Write parametric equations of a line
segment through (7,5) with slope of 3.
Graph the line segment using your equations.
As we saw in Problem 6, we know how
to influence the slope and crossing point.
For this problem, let's try this equation:

 The equation worked!
Problem 8
Investigate the following equation
for different values of a and b:
 What is the curve when a < b? a
= b? a > b?
Let's try a=1 and b=2 first:

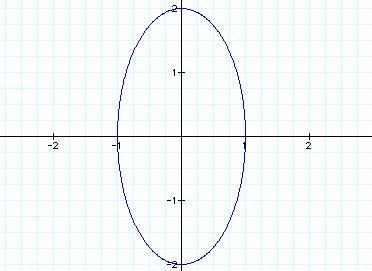 Now let's try a=b=1:

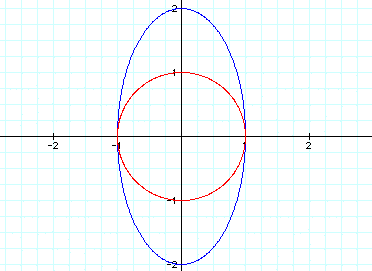 Finally, let's see what happens when
a > b. Let a=2 and b=1:

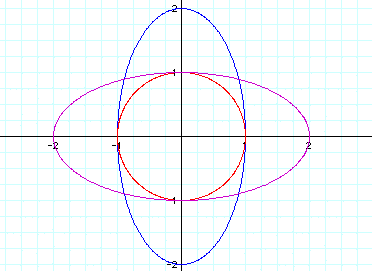 As you can see, the a and b values
influence the shape of what is a circle when a=b.
When b > a, the circle becomes an
ellipsoid that is taller than it is wide.
When a > b, the circle becomes an
ellipsoid that is wider than it is tall.
What would happen if the equation changed
to this:
 where h is any constant number?
Let's let h=1 and try the different
values of a and b again.
When a=1 and b=2, we get this graph:
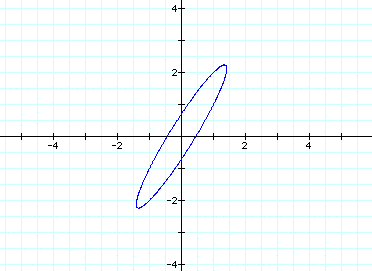 When a=1 and b=1, we get this graph:
 And finally, when a=2 and b=1, we get
this graph:
 Notice that the angle of the ellipsoid
is relatively similar for both b > a and a > b.
Now let's see what happens when h cycles
between -3 and 3, and a=2 and b=1.
The last two parametric equations describe
the locus of the vertex (x,y) of a triangle
with altitude h whose other two vertices
are moved, one along the x-axis and
the other along the y-axis.
Problem 9
With t between 0 and 2pi, describe
each of the following equations when a=b, a < b, and a >
b.
Equation 1 is:
 When a=b=1, we get:
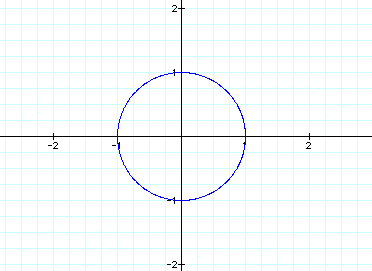 When a < b, let a=1 and b=2 to get:
 Finally, when a > b, let a=2 and
b=2:
 As we saw in Problem 8, this equation
influences the shape of a circle turned into ellipsoids.
Equation 2
 When a=b=1, we get this graph:
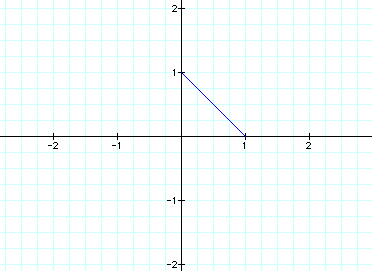 When a < b, let a=1 and b=2 to get
this graph:
 Finally, when a > b, let a=2 and
b=1 to get this graph:
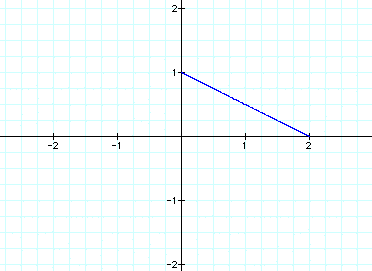 As you can see in these three graphs,
the squaring of the cos and
sin functions in the vector produces
lines connecting the axis intercepts.
Equation 3:
Now let's see what happens when you
take the functions to the third power:
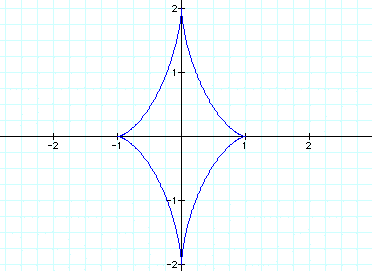
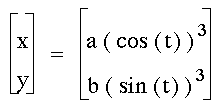 When a=b=1, we get:
 When a < b, let a=1 and b=2 to get
this:
 When a > b, let a=2 and b=1 to get
this:
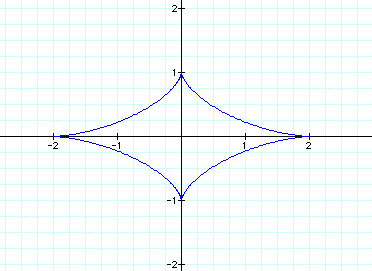 These are interesting. The vector equations
created diamond-like figures
when the equations were cubed. Notice
that the a and b values influence
the height and width of the diamond,
just like they did in the circle equations.
Taking the equations to the fourth-
and fifth-power produce similar graphs
to the second- and third-power equations,
except they become more curved.
Problem 10
Consider the following equation and
graph from -20pi and +20pi:

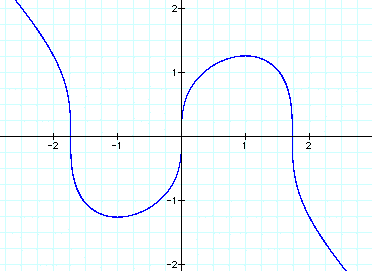 Now consider a second equation:
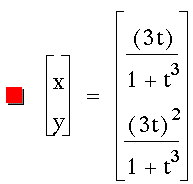 Add this to the original graph to get
this:

Problem
11
Consider the following equation:
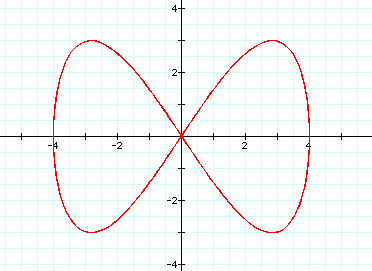
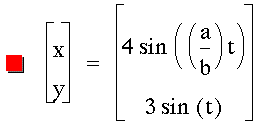 When a/b = 1/2, we get this graph:
 When a/b=1/4, we get this graph:
 When a/b=2/3, we get this graph:
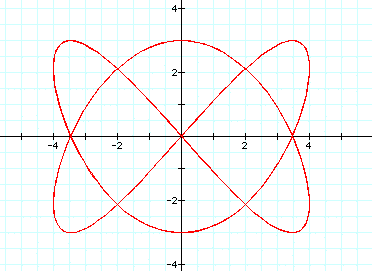 When a/b=12/13, we get this graph:
 This class of parametric curves are
called the Lissojous curves.
Let's compare them with this equation:
 When a=1 and b=2:
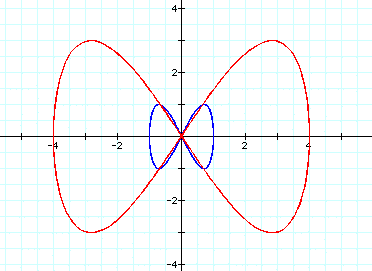 When a=1 and b=4:
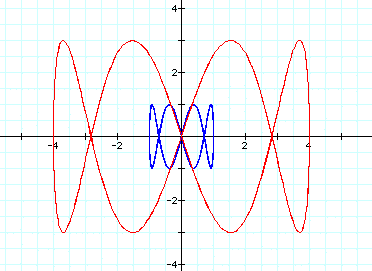 When a=2 and b=3:
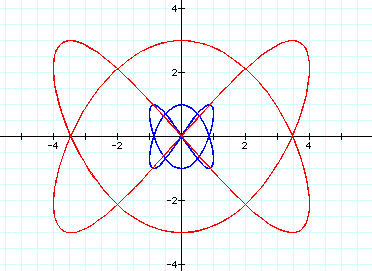 When a=12 and b=13:
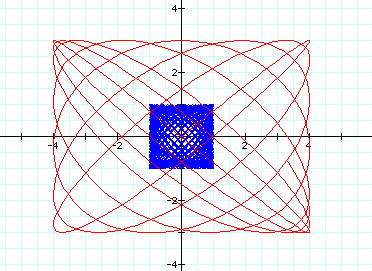 How do these compare?
Problem 12
A cycloid is the locus of a point that
rolls along a line.
Write parametric equations for the
cycloid and graph it.
Consider also a GSP construction of
the cycloid.
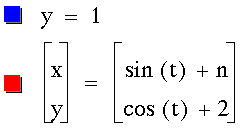
Here are my equations:
Return


