
Assignment 11
Polar Equations
by Jeff Hall
Problem 1
Investigate the following equation:
 It produces this graph:
 When a and b are equal, and k is an
integer, this equation
generates one textbook version of the
"n-leaf rose."
In this example, a, b, and k all equal
1, and t goes from -pi to pi.
How does this equation compare to a
more basic equation:
 When k=1, we get this graph.
 When k=2, we get this graph:
 At this point, it looks like the number
of blue petals is determined by k-squared.
Let's try k=3 just to be sure:
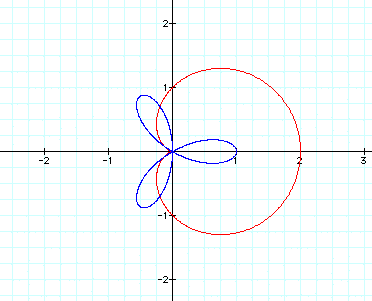 Hmm.... Now the number of blue petals
equals k.
Let's try k=4:
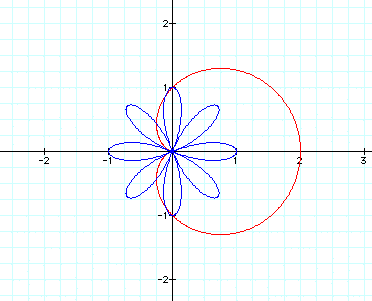 The number of petals now equals k times
2.
Let's try 5:
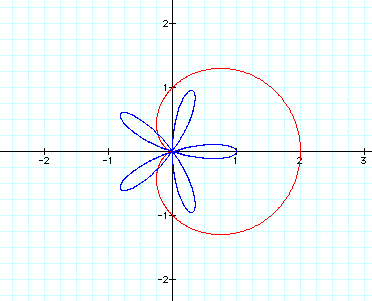 Okay, now we are starting to see a
more defined pattern.
When k is odd, the number of petals equals k.
Now let's try one more even number...try
k=6:
 Since there are 12 petals, we can safely
safe that k*2 works when k is even.
Let's change the original equation's
k value, as well. Let k=2 for both:
 Now try k=3 for both:
 This time, the number of red petals
equals k every time.
Let's try k=4 just to be sure:
 That's it!
What would happen if we changed these
equations from cos to sin?
We get this when k=1:
 It rotated the image 90 degrees counterclockwise.
Problem
2
Investigate the following equations
varying a,b,c, and k:
 When a,b,c, and k=1, we get this graph:
 Let's manipulate k first. Let k=2:
 Now let k=3:
 And k=4:
 Now let's put k back to 1 and try a=2:
 The variable a seems to determine the
size of each circle.
Let's try a=3 to be sure:
 Yes, that's what is happening.
Notice that the red and blue circles
have a as their radius.
Also note that the black line is getting
a steeper slope.
Now put a back to 1 and change b to
equal 2:
 Now try b=3:
 And finally, try b=4:
 Changing b obviously enlarges the green
and purple shapes,
but notice the distortion in their
shapes, as well.
They are becoming more circular.
Also note that the black line's slope
is becoming more horizontal.
Now let's manipulate c. Change b back
to 1 and let c=2:
 Now try c=3:
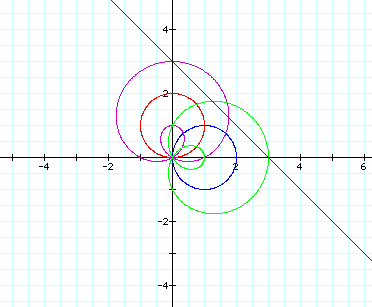 Finally, try c=4:
 As you can see, changing the c only
moves the black line.
Notice the x- and y- intercepts equal
c.
Problem 3
Investigate the following equations
for different values of p:
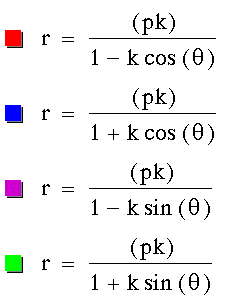 The parameter k is called the "eccentricity"
of these conics.
When p=1 and k=1, we get this:
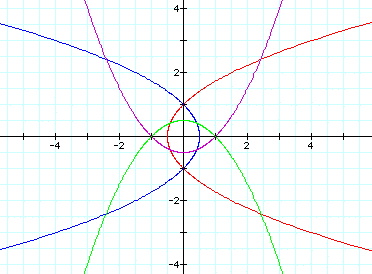 When p=2, we get this:
 When p=3, we get this:
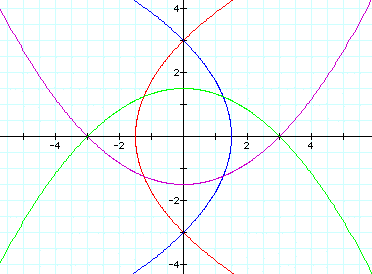 As you can see, each parabola passes
through -p and p on either the x- or y-axis.
Now let k=2 and p=1:
 Now try p=2:
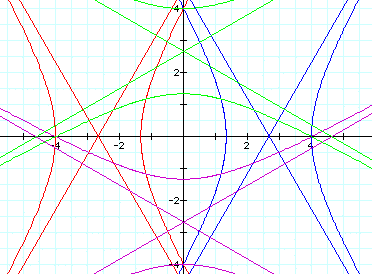 It seems that when k>1, the parabolas
become hyperbolic figures.
Increasing the value of p just widens
these figures apart. Notice that some of
these figures now cross the x- and
y-axes at -2p and +2p.
Now let's try k<1. Change p back
to 1 and let k=0.5
 Now change p=2:
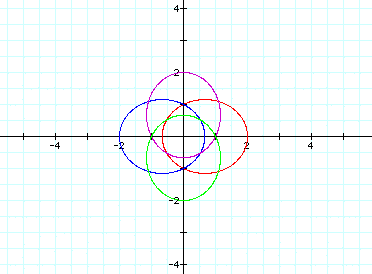 Finally, change p=3:
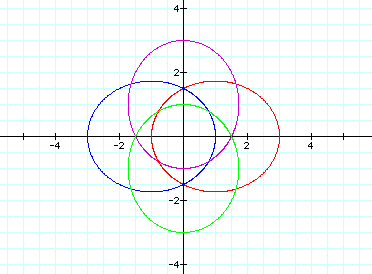 As you can see, when k<1, the parabolic
figures begin to look
like circles. Increases in p make the
figures grow larger.
What happens when k=0? Absolutely nothing,
since each equation is r=0.
What happens when k<0? The graphs
look identical to the respective positive k graph.
The figures may be inverted, but you
can't tell by the way they look on a graph.
Problem 4
Investigate the following equations:
 These equations generate the following
graph:
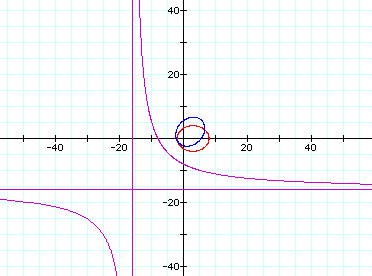 Notice that the blue figure is rotated
in comparison to the red figure.
The purple equation generated a hyperbola.
Now let's see what happens when you
place a 2 in front of each theta:
 Changing the cos to sin in the original
first two equations gives us this:
 Again, the red and blue figures appear
to be similar, just rotated differently.
Problem 5
Try some interesting graphs.
Try this one when a is small, such
as a=0.1:
 We get this graph:
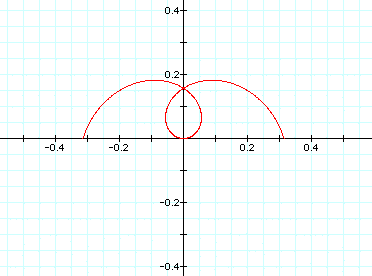 Now put a=1 and add these equations:

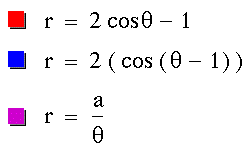
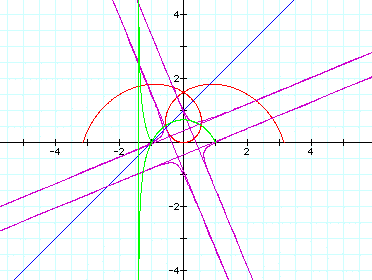 Since this graph has become cluttered
(a hazard of geometry), let's try
graphing these equations on a brand
new graph:

Return


