
Assignment 3
Quadratic and Cubic
Equations
by Jeff Hall
Investigation #1
Let's investigate parabolas
and the roots of equations. First, let's draw parabolas using
the following equation:
 for b = -3, -2, -1,
0, 1, 2, 3
 As you can see, all
of the parabolas cross the y-axis at (0,1). The roots of each
equation occur when
each parabola crosses
the
Now let's add another
parabola:

 The new parabola is
colored black. It crosses the other parabolas at their loci.
Investigation #2
Here is an equation that we want graphed
in the xb plane:


Now
let's add a line where b=3
 The b=3 line crosses the original hyperbola
at two points. These two points are the roots of the equation
when b=3.
Let's zoom in and see how many roots we have when
b=2:
 As you can see, when b=2 there is only
one root of the original equation.
It should now be clear that when -2<b<2,
there are no roots at all.
Let's investigate what happens when
the c variable changes. Let c=-1:

 As you can see, when c=-1, the equation
has exactly two roots at every variable b.
Now let's watch
what happens as c cycles between -10 and 10:
As the c variable fluctuates, notice
the amount of roots the equation has for each value b.
Investigation #3
Now let's add another equation to this
graph:

 What is the relationship of this equation
to the quadratic formula?
This equation is the derivative of
the first equation (drawn in red).
The local minimum and maximum are identified
where these two equations cross.
Investigation
#4
Since we just investigated graphs in
the xb plane, let's try graphs in the xc plane.


Let's
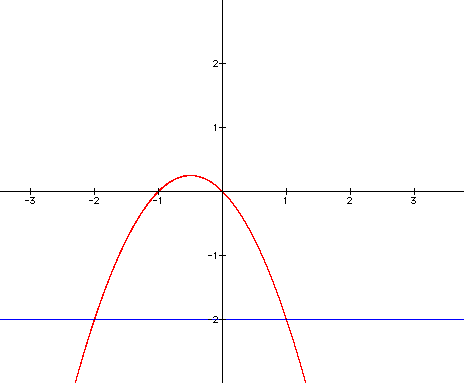
add some equations to this graph. Let c=-2 to show the roots of
the previous equation:
Now
let's add the derivative of the first equation. It should intersect
the parabola at its maximum point.

 As expected, the derivative (drawn
in purple) crosses the parabola at the maximum point.
Finally,
let's watch what happens as c cycles between -10 and 10:
Notice that the maximum point becomes
a minimum point as c becomes negative.
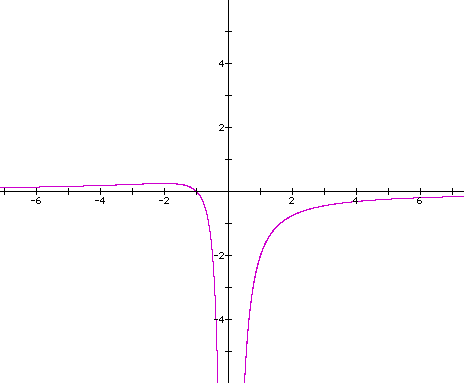
Now let's look at graphs
in the xa plane, starting with the original equation again:

Now
let's add a line where a=-1
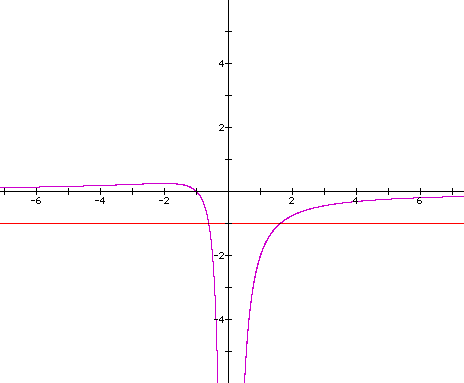 As you can see, once again we get two
roots when a=-1. However, notice how many roots are possible as
the a variable approaches zero. The
number becomes infinite.
Now let's find the derivative of the
equation:

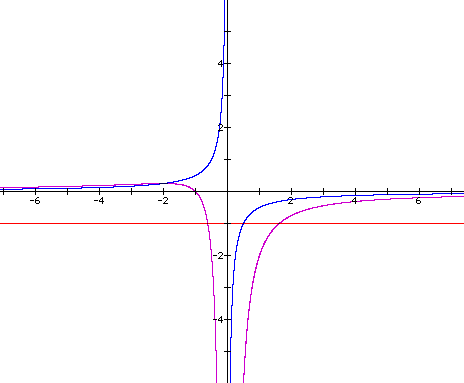 Again, we see that the derivative (drawn
in blue) crosses the original point at the local max and min points.
Finally,
let's zoom in and watch as the variable a fluctuates between -10
and 10.
This time, I will also let the derivative
equation fluctuate along with the original equation:
Investigation
#6
Let's look at a new equation and graph
it in the xb plane:

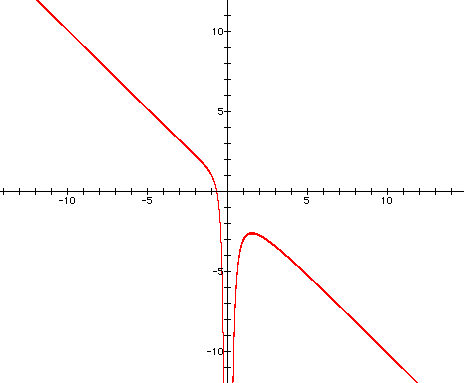 An unusual looking graph...
Can
you predict the maximum number of roots that this equation has?
Let's see how many roots there are
at b=-5:
 As you can see, this equation yields
a maximum of 3 roots. Why, you ask?
Well, I'll tell you! It's because this
equation is a 3rd order quadractic equation.
Look at how the first x variable is
cubed. This tells us that the maximum number of roots will be
3.
Now let's look at the derivative of the equation:

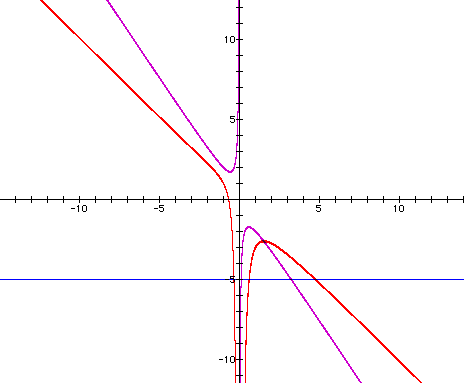 This time, the derivative (drawn in
purple) shows the local maximum for the parabola on the right,
but the curve on the left has no local
min point, so the derivative does not cross it.
Finally, grab
some popcorn and let's watch a movie of the equations as b cycles
between -10 and 10:
Notice how the equations flip around
the b-axis. Also notice how the derivative comes closer
to crossing the left curve as the absolute
value of n gets larger.
That's what I call edge-of-your-seat
excitement!
Return


