

Essay 3
Gingerbread Man
By
Mandy Stein
Problem.
This is a Microsoft Excel file to illustrate iteration of a seed point (x(0), y(0)) by the sequences x(n+1) = 1 - y(n) + abs(x(n)) and y(n+1) = x(n). This point is iterated 500 times and the points plotted in an XY scatter plot. Explore the iteration of various points (x,y) by seeding the initial value of x in cell A1 and the initial value of y in cell B1.
We start by examining the graph we get when x = 0.5 and y = 3. The graph looks like a gingerbread man.
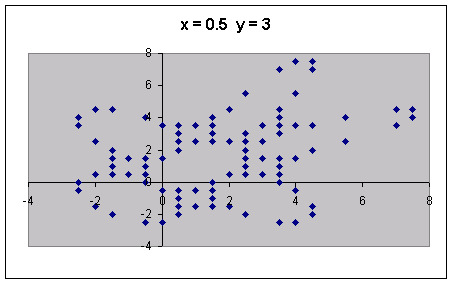
First we will keep y constant and change the value of x.
Let's first look at values of x between 0 and 1.
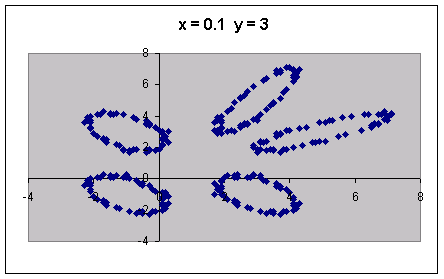
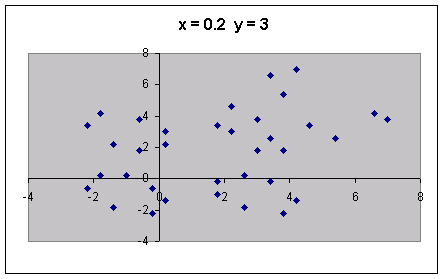
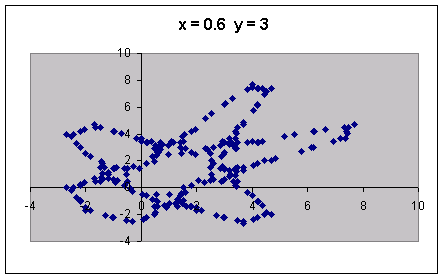
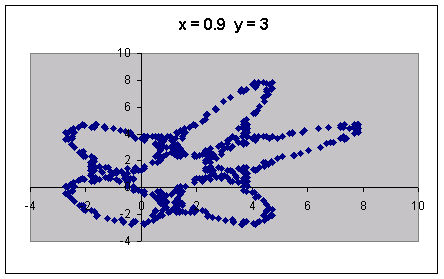
We can see from the graphs that when x equals 0.1 we get a graph of five circles. We get a similar graphs when x equals 0.3 and 0.4. When x equals 0.2 we get a similar graph, but the points are more spread out. When x is equal to 0.6 through 0.9 we get a graph that looks somewhat like a flower as seen above.
Next, we will examine values of x between -1 and 0.
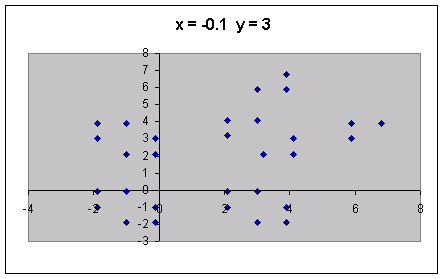
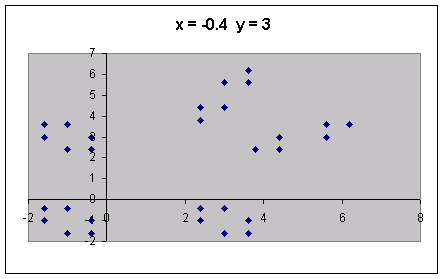
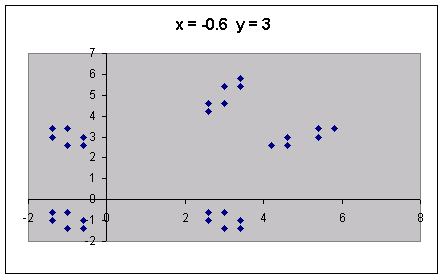
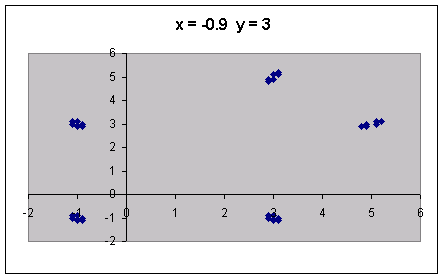
We can see from the graphs that when x equals -0.1 we get a graph similar to the gingerbread man, but with fewer points. Similar graphs are obtained when x is between -0.1 and -0.3. When x equals -0.4 we get a graph with five groups of points, as the x value decreases these groups develop into small circular groups..
Next, we will examine values of x equal to and greater than 1.
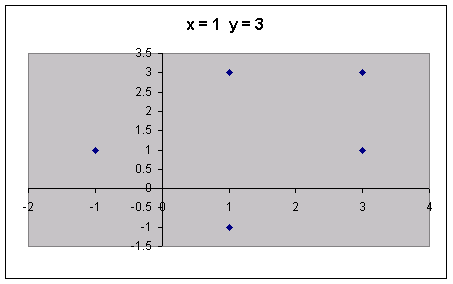
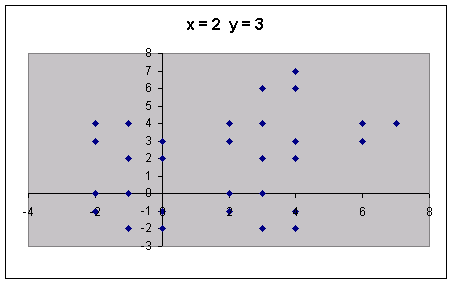
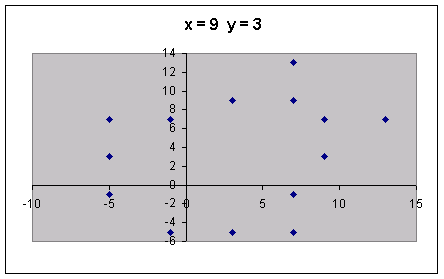
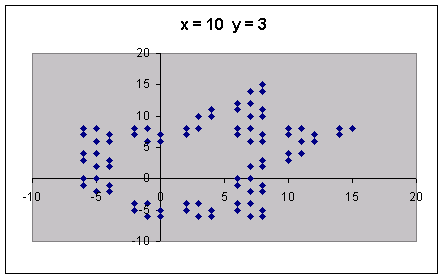
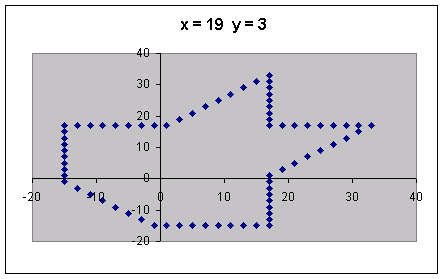
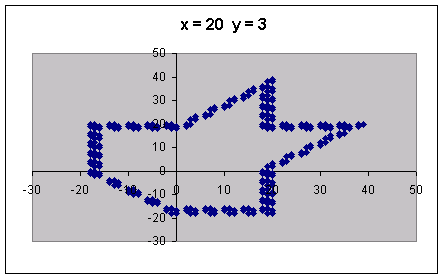
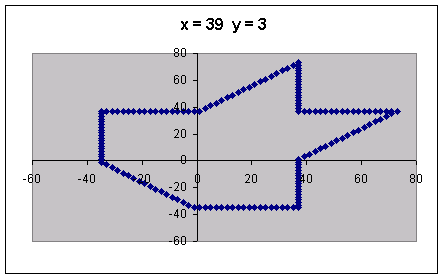
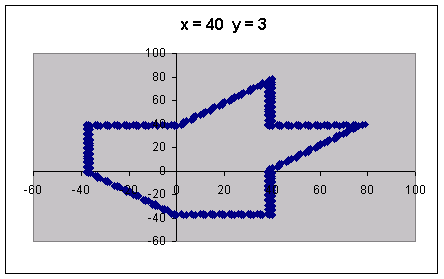
From the graphs, we see that when x = 1 the graph contains five points continuously repeated and when x = 2 the graph contains 24 points continuously repeated. The number of points increases with the value of x. The odd values of x appear to have fewer points than the even values of x, but both even and odd values look similar as the value of x increases.
Next, we will examine values of x equal to and less than -1.
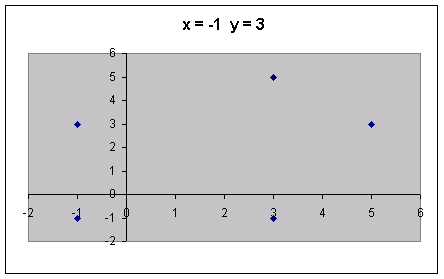
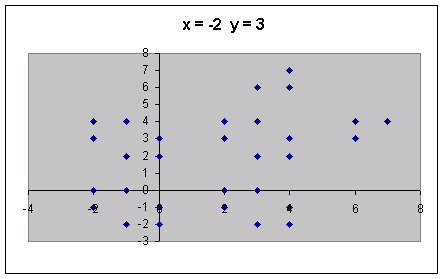
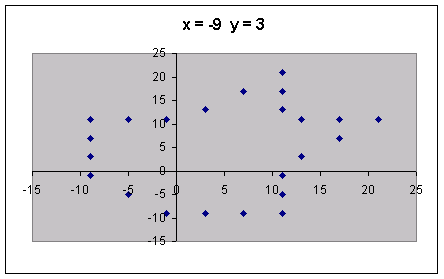
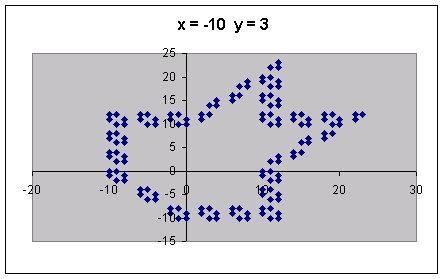
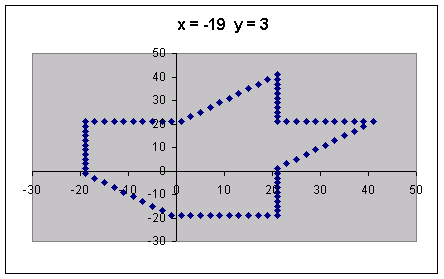
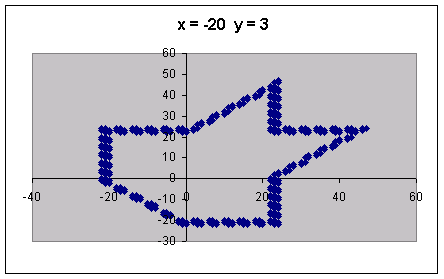
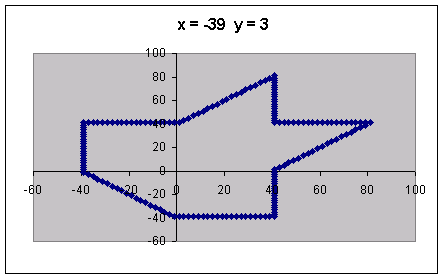
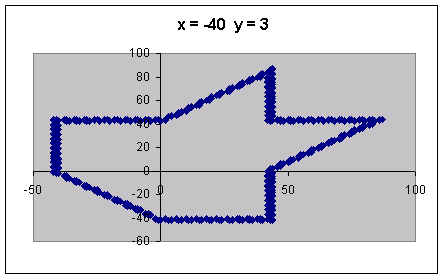
From the graphs, we see that when x = -1 the graph contains five points continuously repeated and when x = -2 the graph contains 24 points continuously repeated. The number of points increases as value of x decreases. The odd values of x appear to have fewer points than the even values of x, but both even and odd values look similar as the value of x decreases. These are the same results we got when the x value were positive, it appears the sequence follows the same pattern regardless of if x is positive or negative.
Next, we will examine what happens when we fix the value of x and alter the value of y.
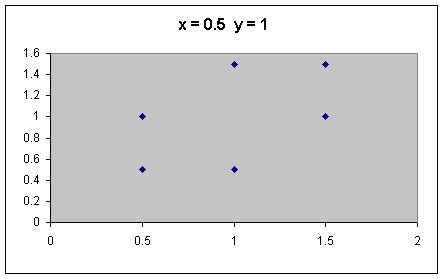
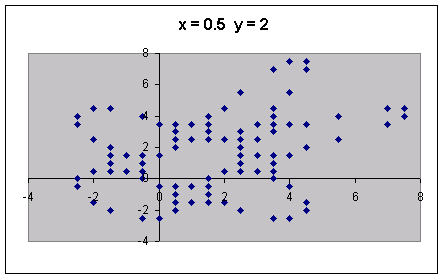
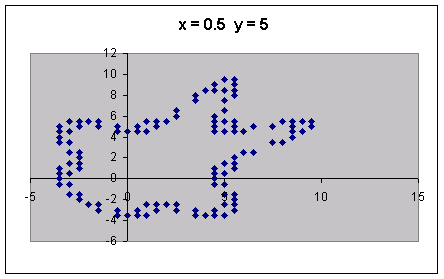
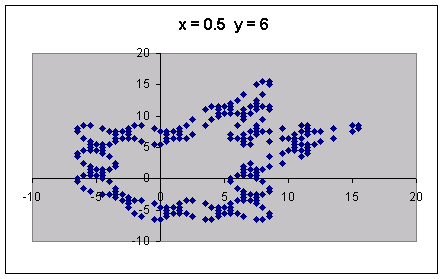
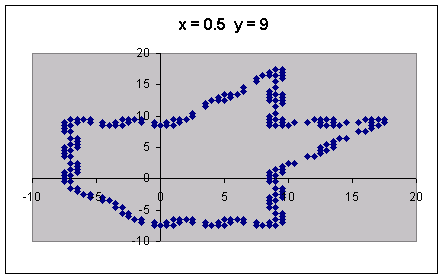
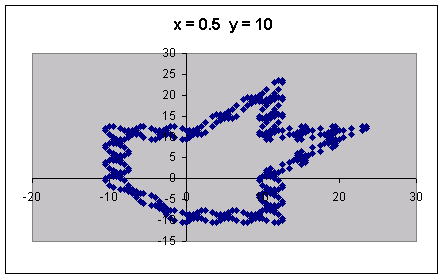
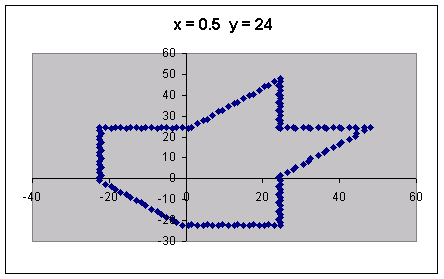
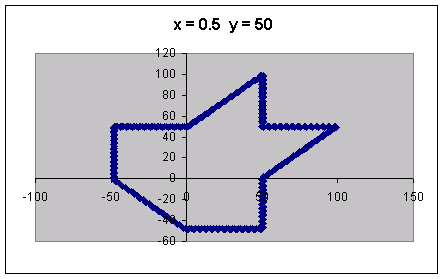
We can see from the graphs that when y equals 1 the graph is five points continuously repeated. When x equals 2, the graph looks similar to the gingerbread man. The graph develops circular objects when y equals 6 through 8. We see that as y increases we get the same graph we got as x increased when the value of y was fixed. Values of y less than -1 produce the same graphs as the positive values, just like the graphs of the altering x values.
Next, we will examine values of y between -1 and 1.
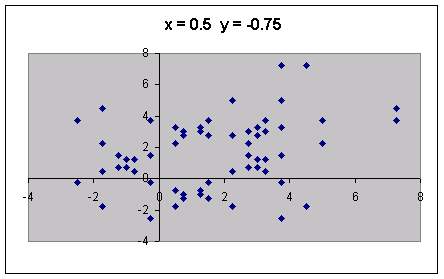
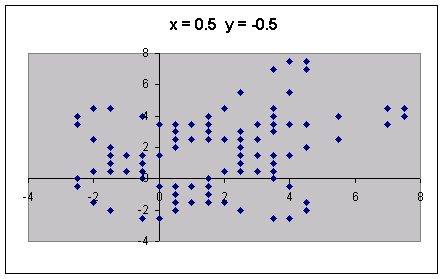
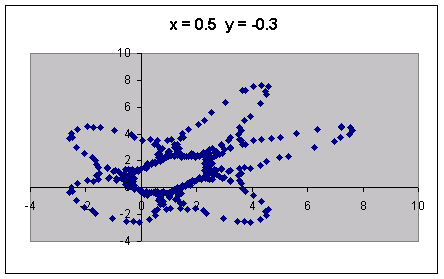
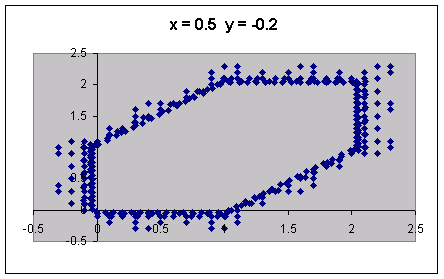
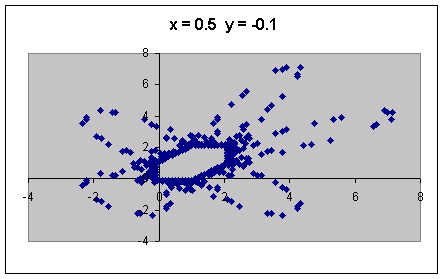
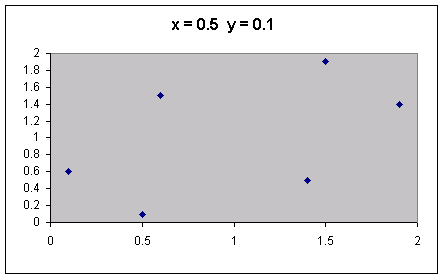
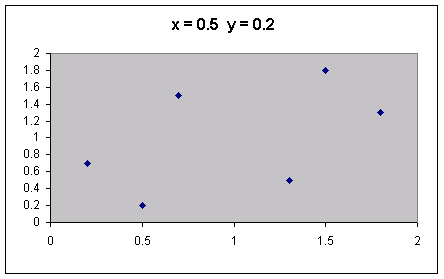
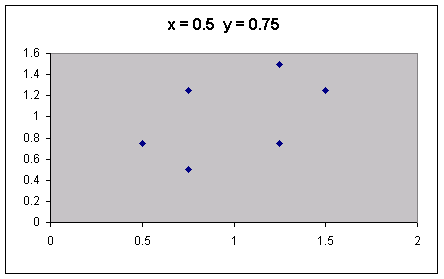
We can see from the graphs that when y is between -1 and -0.5 the graph somewhat resembles a gingerbread man. For all values of y between -0.3 and -0.1 except for -0.2, the graph looks like a flower. When y equals -0.2, all the points are close the the edge of a hexagon. For positive values of y less than 1, the graph appears to be 6 points repeated continuously.
Now we will alter the values of x and y.
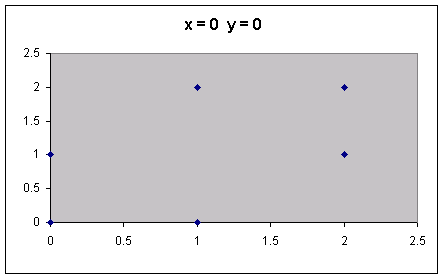
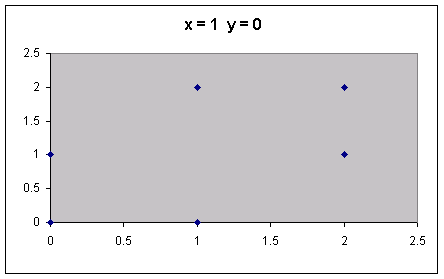
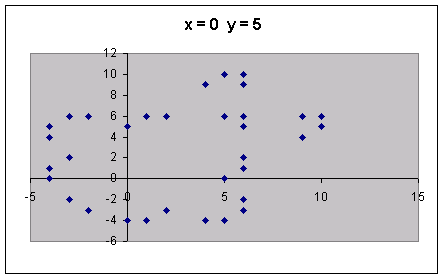
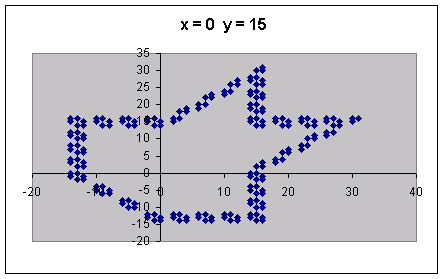
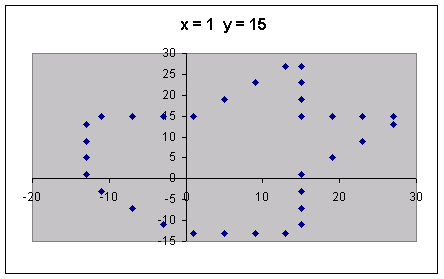
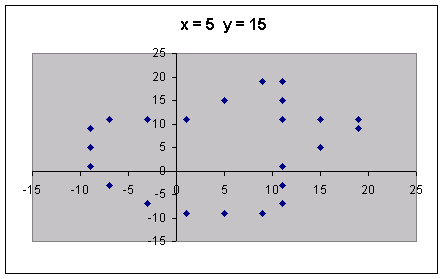
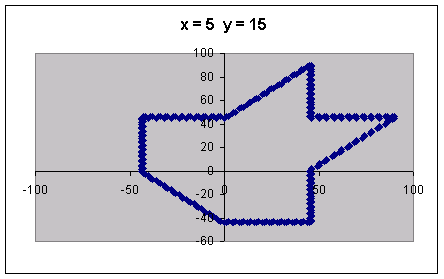
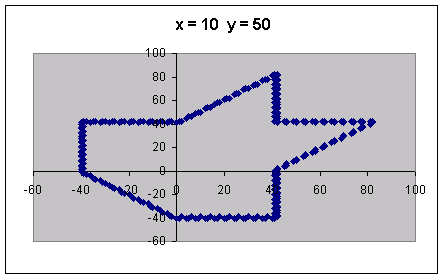
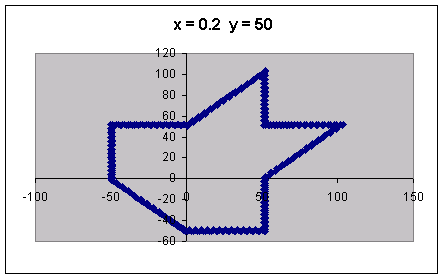
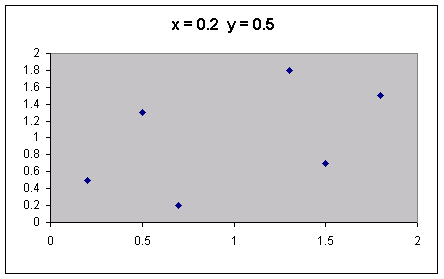
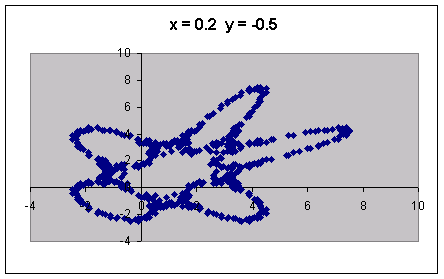
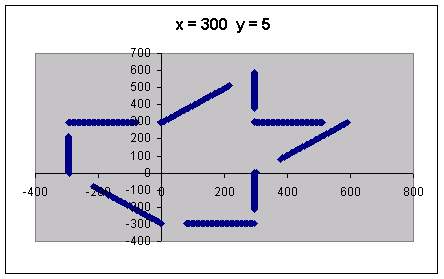
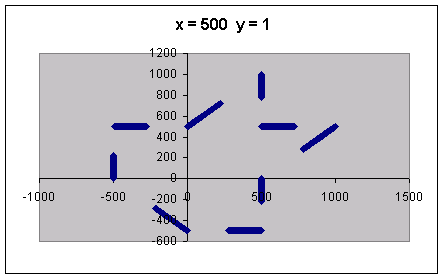
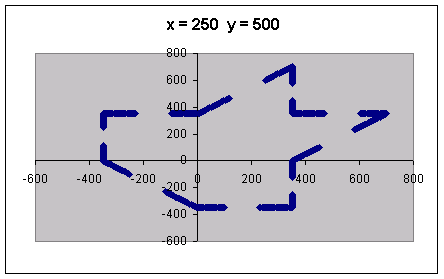
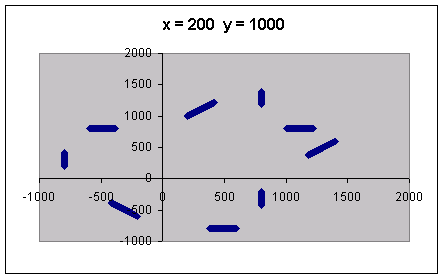
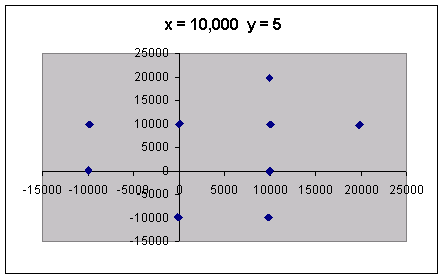
From the graphs we can see that most of the graphs are the same patterns we have seen before. The graphs seem to have the same patterns regardless of which variable is changed, or if both variables are changed. We also set the values of x and y considerable higher than previously and we notice differences in the patterns when the x and y values increase over 250. As both or one of the values increase above 250 the lines start to break apart and eventually become single points. We noticed the same results for positive and negative values as in the graphs above.