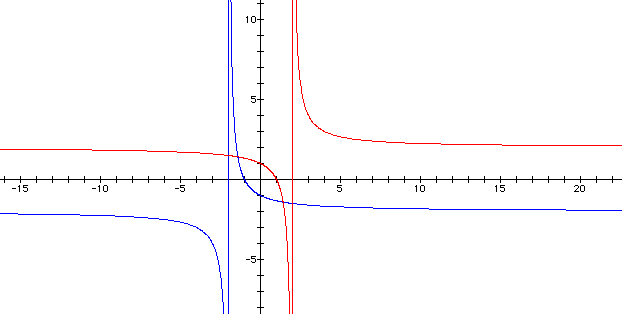

The graph of our original ellipse
is

Here we see that the asymptotes are y =
-2 and x = -2 in rectangular form.
Let's begin by changing the sign of the 2 from positive to negative.

Speaking in terms of rectangular coordinates,
we see that this moved the vertical asymptote to x = 2 and the
horizontal asymptote to y = 2. This movement can be viewed as
a translation along the line y = x.
Now, let's change the sign of the 1 in denominator.

There is no difference between the original
graph and this one.
Now, let's see what happens when we make the equation
Here we see the original graph with the graph of the altered equation.

Notice that the new graph is a reflection
of the original across the line y = 0. Also, the horizontal asymptote
has shifted, as we may have expected remembering that ![]() ,
so by changing the coefficient of sine, we have altered the y
values. The asymtotes (in rectangular form) are now x = -2 and
y = 2.
,
so by changing the coefficient of sine, we have altered the y
values. The asymtotes (in rectangular form) are now x = -2 and
y = 2.
Finally, let us investigate how the graph of the original equation alters when we change the sign of the cosine term in the denominator. If the graph acts in a manner similar to the previous example, we would expect the y asymptote to remain unchanged while the x asymptote does change.
The original equation and the new equation.

Here, we readily see that
the new graph is the reflection image of the original across the
y axis ( x = 0). So, indeed the horizontal asymptote y = -2 did
not change while the vertical asymptote moved to x = 2.
Return