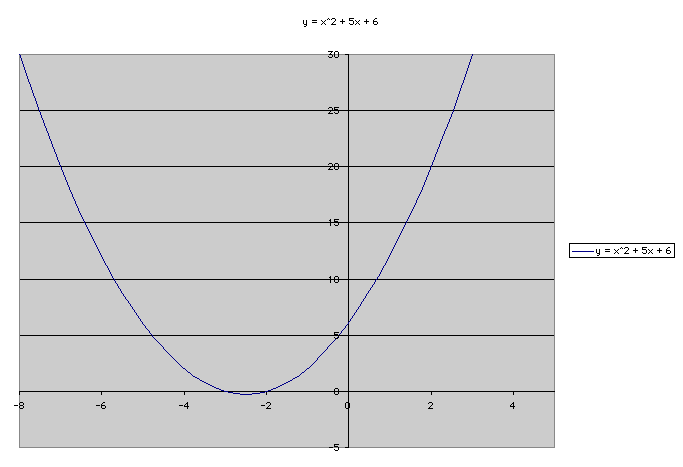
Using a Microsoft Excel spreadsheet, I want to able able to construct a graph for any function y = f (x). This can be done by generating a table of values with the x values in one colum and the y avlues in another.
The function I want to explore is
First I want to set up the spreadsheet.
| x | y = x^2 + 5x + 6 |
| 1 | 12 |
| 2 | 20 |
| 3 | 30 |
| 4 | 42 |
| 5 | 56 |
| 6 | 72 |
| 7 | 90 |
| 8 | 110 |
| 9 | 132 |
| 10 | 156 |
| 11 | 182 |
| 12 | 210 |
| 13 | 240 |
| 14 | 272 |
| 15 | 306 |
| 16 | 342 |
| 17 | 380 |
It becomes easier to set up the spreadsheet if you know the short cuts to take like autofill and cut and paste.
Then we will go into the graphing mode and select a x-y scatterplot.
