Some Different Ways to Examine
![]()
by
James W. Wilson and Mark C. Cowart
It has now become a rather standard exercise, with available
technology, to construct graphs to consider the equation ![]() and to overlay
several graphs of
and to overlay
several graphs of ![]() for different values of
a, b, or c as the other two are held constant. From these graphs discussion
of the patterns for the roots of
for different values of
a, b, or c as the other two are held constant. From these graphs discussion
of the patterns for the roots of ![]() can be followed. For example, if
we set
can be followed. For example, if
we set ![]() for b= -3, -2, -2, -1, 0, 1, 2, 3, and
overlay the graphs, the following picture is
for b= -3, -2, -2, -1, 0, 1, 2, 3, and
overlay the graphs, the following picture is
obtained: 
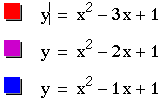
 The value of b can be matched by looking at the colors.
We can discuss the "movement" of a parabola as b is changed. Note
the following observations:
The value of b can be matched by looking at the colors.
We can discuss the "movement" of a parabola as b is changed. Note
the following observations:
1) The parabola always passes through the same point on the y-axis (which is (0,1) for this equation).
2) For b=2 or -2, the parabola is tangent to the x- axis.
3) For negative b values the parabola shifted right. For positive b values it shifted to the left.
4) For b>2 or b<-2, the parabola will intersect the x-axis at two distinct points that are real roots.
5) The locus of points of the vertices of each parabola
is a new parabola whose equation is ![]() . It
might be helpful to examine a graph this equation in order to see the vertices
being connected.
. It
might be helpful to examine a graph this equation in order to see the vertices
being connected.
A generalization drawn from statement 5 above is that for equations of the form
![]() , the locus parabola passing through the vertices of the
set of their graphs will be of the form
, the locus parabola passing through the vertices of the
set of their graphs will be of the form ![]() .
.
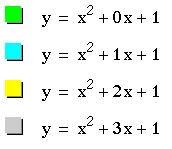
Graphs in xb plane: (Note:
Instead of using ![]() , let b = y in order to
graph better.)
, let b = y in order to
graph better.)
Consider again the equation ![]() where
the b value has been replaced with y. The graph of this equation in the
xy plane is:
where
the b value has been replaced with y. The graph of this equation in the
xy plane is:
(This graph of this relation also examines the xb plane.)
If any particular value of y is taken, such as y=3, and overlaid on the above equation, the graph would add a line parallel to the x-axis. If it intersects the curve in the xy plane the intersection point corresponds to the roots of the original equation for that value of b. Notice the following graph:
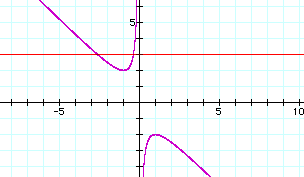
For each value of y selected, we get a horizontal line. The following generalizations can be found:
1) On a single graph there are two negative real roots of the original equation when y>2.
2) There are no real roots for -2<y<2.
3) One positive real root when y=-2.
4) There are two positive real roots when y<-2.
Similar explorations can be done for the xc plane as well. Make your own generalizations.
Return to Mark's home page