

I changed the color of the axis so you could see the graph better. The graph
did not form a horizontal line like suspected. Instead, it formed 2 lines,
one horizontal at x = 0 and one vertical at y = 0. This is because of the
implicit equation. The term by is still in the equation even though "b"
= 0. So, the parent graph of this equation is two lines, one horizontal
and one vertical, that cross at the origin.
The next logical choice would be to try the equation xy = 0a + y + 0. This
way we will take a good look at all the extreme cases. Below is the graph
of the equation.

A translation has occurred. The graph of the same two (vertical and horizontal)
lines has moved from an intersection point at (0,0) to an intersection point
at (1,0).
Let's visit the last case xy = 0x + 0y + 1. Earlier, we found out the "a"
variable moved the graph up and down, while the "b" variable moves
the graph left and right. Any hypothesis on how the graph will change?
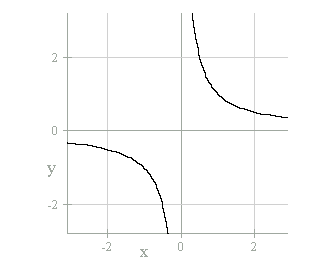
Finally, we have arrived into the family of hyperbolas. This is the parent
graph with asymptotes at x = 0 and y = 0.
Let's now visit the graph of xy = x + y + 1. Any guesses on how the graph
will look?
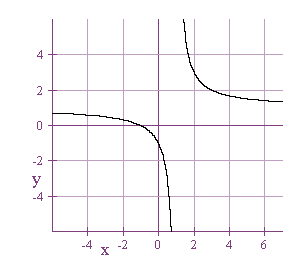
This is a hyperbola with asymptotes at x = 1 and y = 1. The parent
graph of the hyperbola has asymptotes at x = 0 and y = 0 and the graph is
also in the first and third quadrant like the graph above. Why are they
similar? If you manipulate the equation of the graph, you will get y = (x
+ y + c) / x, which is a form of a hyperbola.
I would like to start this part of the exploration by investigating different
values of the variable "a", while "b" = 1 and "c"
= 1. Using Theorist to animate the graph, it shows the "y" asymptote
moves from y = 1 to y = a. What do I mean? If the variable a is equal to
4, the asymptotes would be at x = 1 and y = 4. xy = 4x + y +1
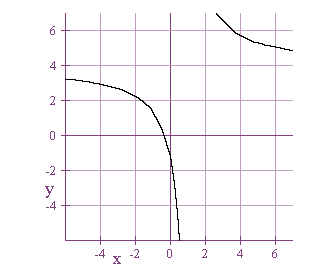
A translation is a type of a linear transformation. The graph above has
been moved from y =1 to y =4. Are there any special cases? The animation
of the "a" variable tested a range from one to 100. The graph
continually moved up the y-axis, but the x asymptote stayed the same.
The next logical step was to test negative values for the "a"
variable. First, the program performed an animation of the variable "a"
between -10 and 10. I noticed something different about the graph. At -10
to around -1, the graphs were in the second and fourth quadrants, but the
graph changed from 0 to 10. I decided to test a larger range of negative
"a" values to see if this was the only place this happened. After
testing the range -100 to 100, I found out that the change did take place
somewhere between -1 and 0. So I manually started plugging in different
values for "a" to see what was happening. At "a" = -1
the graph looks like the following: xy = -x + y + 1
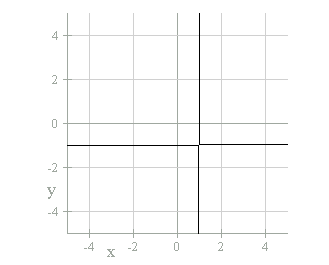
The graph no longer looks like a hyperbola, instead it resembles two lines
that cross
Now, look at the graph of the equation with the variables "a"
= -1.05, "b" = 1, and "c" = 1.
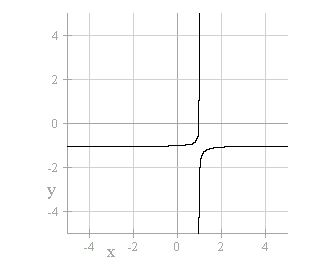
The curve now looks like it is behaving like a normal hyperbola, but changed
the quadrants it resides in (quadrant two and four).
To summarize our exploration of the "a" variable:

To continue this exploration, let's fix "a" and "c",
then vary "b". The graph below is xy = x + 2y + 1.
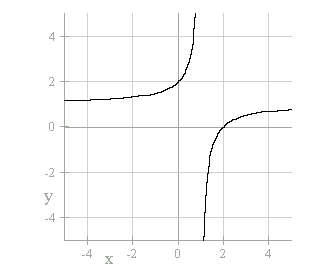
The graph behaves like suspected, it moves to the right one unit from the
original graph where all the coefficients are one. Next, I want to animate
the graph to see if there are any unusual points. First let's try "b"
= -1.04, since this was the unusual point when "a" = -1. The graph
below is xy = x + (-1.04)y + 1.
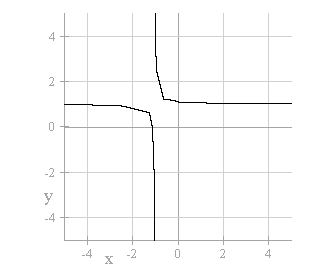
Notice, this graph is not a horizontal line and a vertical line crossing
like before, but the graph is not a hyperbola either. After further exploration
of the problem, I found out the graph is suppose to be close to two lines
that cross. The graph is in the first and third quadrants. The end points
do not seem to be approaching any number. So, let me test another number
"b" = -1.05.
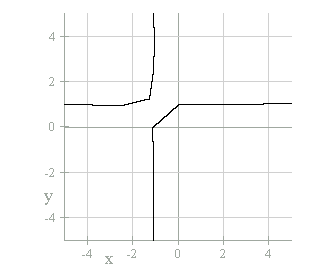
Interesting, the graph changes to the second and fourth quadrants,
just like the variable "a".
Some conclusions about the effects of the "b" coefficient:

The two curves spread out more when you replace c = 1, with c = 2 and have
asymptotes at x = 1 and y = 1. The next logical step is to animate the coefficient
c for positive values. After completing the animation, it is obvious the
effects of "c". As "c" gets larger in the positive direction,
the two curves spread out further apart and lie in the first and third quadrants.
Now let's test the value "c" = -1.
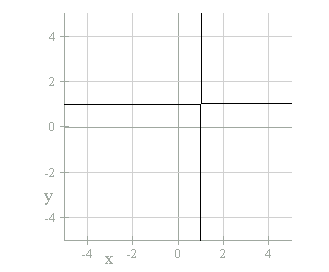
Guess what you get? It looks like two lines that cross at (1,1).
All three coefficients had a special case, when the coefficient = -1. So,
let's look at the graph of xy = x = y -2.

The graphs lie in the second and fourth quadrants. The asymptotes
of the hyperbola are y = 1 and x = 1 ( that's because a = 1 and b = 1).
As you test other negative values of "c", you can see, the graph
spread out further as "c" approaches negative infinity.
This exploration covered several different combinations of the coefficients
"a", "b", and "c".