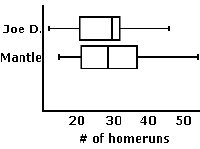
The five-number summary for DiMaggio is:
| 12 | 20.5 | 30 | 32 | 46 |
The five-number summary for Mantle is:
| 15 | 21 | 28.5 | 37 | 54 |
Here is the side-by-side boxplots of the home run distributions:

This comparison shows that DiMaggio was more consistent (due to the smaller spread) with his homerun production. Mantle's typical homerun production is slightly better than DiMaggio's because the spread of Mantle's distribution is a bit better and the medians are close. We cannot say anything about possible outliers from boxplots.
NOTE: For a better comparison use a side–by–side stemplot.