 once then
  twice then ENTER
 once
once
* min=7 and max<8.5 means the first class is from 7 to 8.5 (but not including 8.5)
* n=7 means there are 7 data points in this class
* use the right arrow key to get the information of the other classes
| Steps | Key Sequence | Screens |
| 1. Enter data into list, L1 | ||
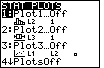
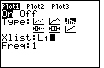
| 2. Set up Stats Plotter | 2nd then Y= | |
| 3. Select Plot1 | 1 | |
| 4. Turn Plot1 On | ENTER | |
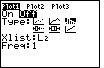
| 5. Select histogram | once then twice then ENTER |
|
| 6. Select list L1 | once |
|
| If you see an A in the blinking cursor then press ALPHA | |
|
| press 2nd then 1 | |
|
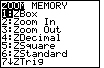
| 7. Graph | ZOOM | |
| 9 (for ZoomStat) | |
|
| Steps | Key Sequence | Screens |
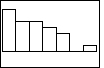
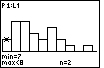
| 8. Find the details | TRACE | |
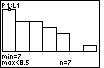
| * P1:L1 means this is Plot1 of L1 * min=7 and max<8.5 means the first class is from 7 to 8.5 (but not including 8.5) * n=7 means there are 7 data points in this class * use the right arrow key to get the information of the other classes |
||
| Steps | Key Sequence | Screens |
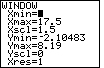
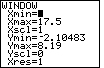
| 9. Change the class width | WINDOW | |
| Change Xscl to new class width | |
|
| 10. Graph | GRAPH then TRACE | |
| NOTE: If you want a specific number of classes, say 12, then find the new class width by (max – min)/12. | ||