 once
once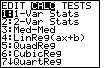
 is the mean * Sx is the sample standard deviation * σx is
the population standard deviation
is the mean * Sx is the sample standard deviation * σx is
the population standard deviation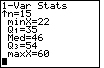
* Q3 is the third quartile * maxX is the maximum value
| Steps | Key Sequence | Screens |
| 1. Enter data into list, L1 | ||
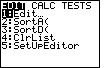
| 2. Select 1–Var Stats | STAT | |
| once |
|
|
| ENTER | |
|
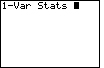
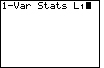
| 3. Select the list, L1 | 2nd then 1 | |
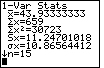
| 4. Find the Statistics | ENTER | |
| * is the mean * Sx is the sample standard deviation * σx is
the population standard deviation |
||
| 5. Find the 5-number summary | use down arrow key to scroll all the way down | |
| * minX is the minimum value * Q1 is
the first quartile * Med is median * Q3 is the third quartile * maxX is the maximum value |
||