
1. Explain why it is important to identify the domain and range values of a relation when graphing the relation
2. Refer to the application at the beginning of the lesson. Explain what the manatee graph suggests about patterns in the rate of manatee deaths.
3. State the relationship between the domain and reange of a relation and the domain and range of its inverse
4. Graph the relation {(0, 5), (2, 3), (1, -4), (-3, 3), (-1, -2)}. Draw a line that goes through the points (-3, -3) and (3, 3). Use this line to graph the inverse of the relation without writing the ordered pairs of the inverse.
State the domain and range of each relation:
5. {(0, 2), (1, -2), (2, 4)}
6. {(-4, 2), (-2, 0), (0, 2), (2, 4)}
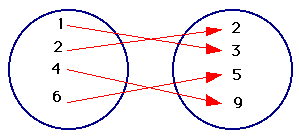
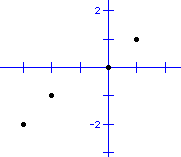
Express the relation shown in each of table, mapping, or graph as a set of ordered pairs. Then state the domain, range, and inverse of the relation.
7.
| x | y |
| 1 | 3 |
| 2 | 4 |
| 3 | 5 |
| 5 | 7 |
8.

9.

10. Graph the relation shown in #7
Bonus: Graph the relation shown in #8