
1. Analyze the graphs in Examples 1 and 2 along with the ratios of the range differences to the domain differeces. Then complete these sentences.
a. If the ratio is positive, then the line slants ______________ .
b. If the ratio is negative, then the line slants ______________ .
2. Explain how you can determine if an equation correctly represents a relation given as a table.
3. Write a linear equation in funcitonal notation that has both (1, 1) and (0, 3) as solutions. Is this the only linear equation that has these two solutions? Explain.
Write an equation in functional notation for each relation.
4.
|
|
|
|
|
|
|
|
|
|
|
|
|
|
5.
|
|
|
|
|
|
|
|
|
|
|
|
|
|
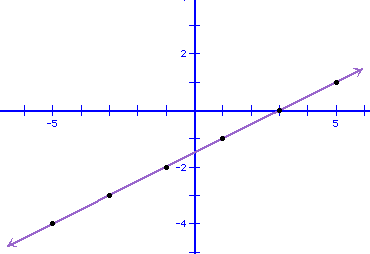
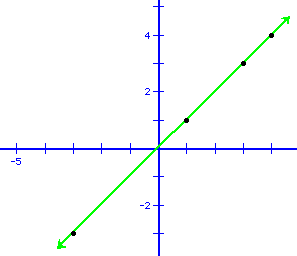
Write an equation for each graphed relation.
6.

7.

8. The table below represents values for the function N(m). Copy and complete the table. Explain how you determined the missing value.
|
|
|
|
|
|
|
|
|
|
|
|
9. Most substances contract when they freeze. However, water expands in volume when it freezes. Eleven cubic feet of water becomes 12 cubic feet of ice, 33 cubic feet of water becomes 36 cubic feet of ice, and 66 cubic feet of water becomes 72 cubic feet of ice.
a. Make a graph of these data.
b. Write a functional equation for the relationship between the volume of the water and the corresponding volume of ice.