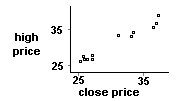
 . The linear regression model for
this data is:
  = 1.03 x – 0.17. Thus, the predicted highest price
tomorrow if the close price today is $20 would be:
  = 1.03 (20) –
0.17 = $20.44.
= 1.03 (20) –
0.17 = $20.44.Below are the close prices and highest prices (next day) of a stock in NASDAQ:
| Close price, x | 27.94 | 26.75 | 26.19 | 27.19 | 26.69 | 27.87 | 37.06 | 36.81 | 36.38 | 33.50 | 31.44 | 33.25 |
| High price (next day), y | 27.38 | 27.44 | 26.81 | 27.50 | 28.13 | 28.44 | 39.38 | 37.06 | 36.13 | 34.63 | 33.88 | 33.63 |
Adapted from http://www.uoregon.edu/~qmshao/fall98/243ch2.pdf
ANSWERS:

 . The linear regression model for
this data is:
  = 1.03 x – 0.17. Thus, the predicted highest price
tomorrow if the close price today is $20 would be:
  = 1.03 (20) –
0.17 = $20.44.