| Steps |
Key Sequence |
Screens |
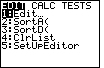
| 1. Set up Stats Tests |
STAT |
 |
| |
 twice twice |
 |
| |
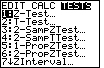
4 (for 2–SampTTest...) |
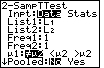 |
| 2. Select Stat |
use right arrow key (if necessary) to move cursor to Stat, then ENTER |
 |
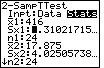
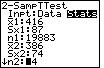
| 3. Input mean of SAMPLE |
 once, enter mean of SAMPLE1, then ENTER once, enter mean of SAMPLE1, then ENTER |
 |
| 4. Input standard deviation |
enter standard devation of SAMPLE1, then ENTER |
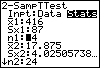 |
| 5. Input sample size |
enter sample size of SAMPLE1, then ENTER |
 |
| 6. Input mean of SAMPLE |
enter mean of SAMPLE2, then ENTER |
 |
| 7. Input standard deviation |
enter standard devation of SAMPLE2, then ENTER |
 |
| 8. Input sample size |
enter sample size of SAMPLE2, then ENTER |
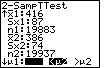 |
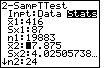
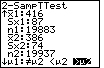
| 9. Select test |
Using arrow keys, select desired test, then ENTER |
 |
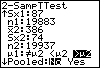
| 10. Enter no for Pooled |
use left arrow key (if necessary) to move cursor to No, then ENTER |
 |
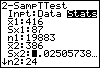
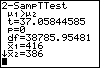
| 11. Calculate P–value |
once, ENTER |
 |
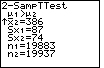
| 12. Scroll down to find more calculations |
Press |
 |
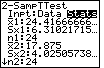
| In this case, the test was Ha: μ1 > μ2;
the t statistic is 37.058; the p–value is 0; the df is 38785.95481, etc. |