| Steps |
Key Sequence |
Screens |
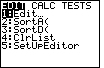
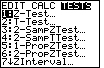
| 1. Set up Stats Tests |
STAT |
 |
| |
 twice twice |
 |
| |
ALPHA, then APPS (for 2–PropZInt...) |
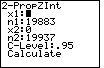 |
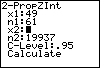
| 2. Input number of successes for SAMPLE1, x1 |
enter value for x1, then ENTER |
 |
| 3. Input number of observations in SAMPLE1, n1 |
enter value for n1, then ENTER |
 |
| 4. Input number of successes for SAMPLE2, x2 |
enter value for x2, then ENTER |
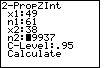 |
| 5. Input number of observations in SAMPLE2, n2 |
enter value for n2, then ENTER |
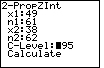 |
| 6. Input confidence level |
enter confidence level (AS DECIMAL), then ENTER |
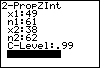 |
| 7. Calculate confidence interval |
ENTER |
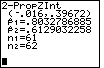 |
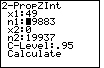
In this case, the 99% CI is from –0.016 to 0.39672;
 1 is 0.8033;
2 is 0.6129; n1 is 61
and n2 is 62. 1 is 0.8033;
2 is 0.6129; n1 is 61
and n2 is 62. |