| Steps |
Key Sequence |
Screens |
| 1. Enter observed counts into Matrix [A] |
|
|
| 2. Enter expected counts into Matrix [B] |
|
|
| NOTE: Matrix [A] and matrix [A] MUST have the same dimensions, r × c. |
| NOTE: In reality matrix [B] need not be defined! |
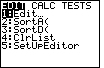
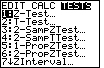
| 3. Set up Stats Tests |
STAT |
 |
| |
 twice twice |
 |
| |
ALPHA, then PRGM (for χ2–Test...) |
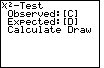 |
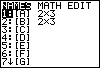
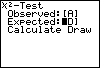
| 4. Enter matrix with observed data |
2nd then x -1 key (for MATRIX) |
 |
| |
1 (for Matrix [A]), then ENTER |
 |
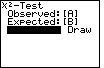
| 5. Enter matrix with expected data |
2nd then x -1 key (for MATRIX) |
|
| |
2 (for Matrix [B]), then ENTER |
 |
| 6. Calculate the statistic |
ENTER |
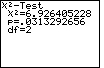 |
| In this case, the chi–squared statistic is 6.926; the p–value
is 0.0313; the degrees of freedom is 2. |
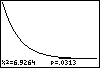
| 7. Draw the test |
repeat steps 1 through 4 (the data should already be stored!), then
once, then ENTER |
 |