| Steps |
Key Sequence |
Screens |
| 1. Enter data into list, L1 |
|
|
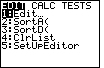
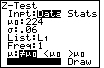
| 2. Set up Stats Tests |
STAT |
 |
| |
 twice twice |
 |
| |
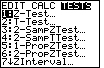
1 (for Z-Test...) |
 |
| 3. Select Data |
use left arrow key (if necessary) to move cursor to Data, then ENTER |
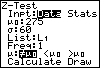 |
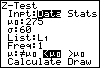
| 4. Input POPULATION mean |
 once, enter population mean, then ENTER once, enter population mean, then ENTER |
 |
| 5. Input POPULATION standard deviation |
enter POPULATION standard deviation, then ENTER |
 |
| 6. Select list, L1 |
(press ALPHA), then 2nd, then 1, then ENTER |
 |
| 7. Select appropriate test |
twice, ALPHA, then use right and left arrow keys to move
cursor to appropriate test, then ENTER |
 |
| 8. Calculate Z–Test |
once |
 |
| |
ENTER |
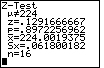 |
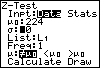
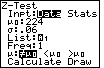
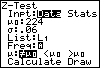
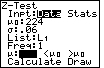
| In this case, the test was H0: μ not equal to 224; the one–sample
z statistic is 0.129; the p–value is 0.897; the sample mean is 224.00; the sample
standard deviation is 0.0618 and the sample size is 16. |
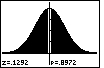
| 9. Draw the test |
repeat steps 1 through 7 (the data should already be stored!), then
once, then ENTER |
 |