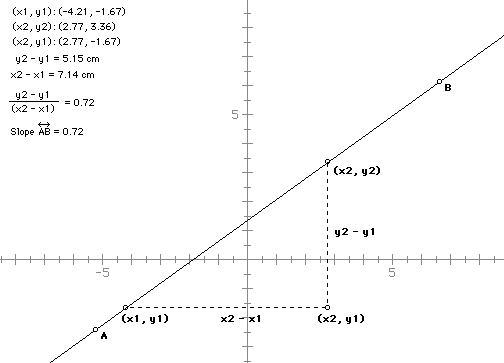

To make this screen enter GSP, turn on the Axes but not the grid. If
you leave the grid on, it could make the motion of the line "jerky."
Next, simply construct a line between two points A and B. This is the basic
model for the exploration. GSP will allow the explorer to dynamically change
the line in two ways. By clicking on the line, the explorer can move the
line with out changing the slope. By clicking on one of the points, A or
B, the line will rotate about the other point, thus changing the slope.
If you have GSP on your computer and would like to explore the basic screen
click here.

The following guide/questions might help the students get more out of
the exploration.
EXPLORATIONS
1) Move the point B.
Describe how the coordinates of the various points (x1, y1), (x2, y2) and
(x2, y1) change.
Describe how the difference of the x coordinates change (x2 - x1).
Describe how the difference of the y coordinates change (y2 - y1).
Is there a connection between the ratio of the differences and the slope
of the line AB? Can you make a generalization from this?
As the line approaches horizontal, what happens to x2 - x1? y2 - y1? the
slope of AB? When the line is horizontal can you explain why the slope is
what it is?
As the line approaches vertical, what happens to x2 - x1? y2 - y1? the slope
of AB? When the line is vertical can you explain why the slope is what it
is?
2) Move the point A to the lower right hand corner of the screen (4th quadrant),
and move the point B to the upper left hand corner of the screen (2nd quadrant).
Did the slope change? How? Can you explain why?
Can you describe when the slope will be positive and when it will be negative?
How does this relate to the points (x1, y1), (x2, y2) and (x2, y1)?
3) Summarize what have you learned about the slope of a line.
These are just a few questions to get started, and the teacher should feel
free to add others. By moving the various points around, the students should
get a feel for the concept of slope. At the bare minimum, they have seen
many different lines in a short period of time, and they did not even have
to graph any of them. If you have GSP and would like to explore this set
up click here

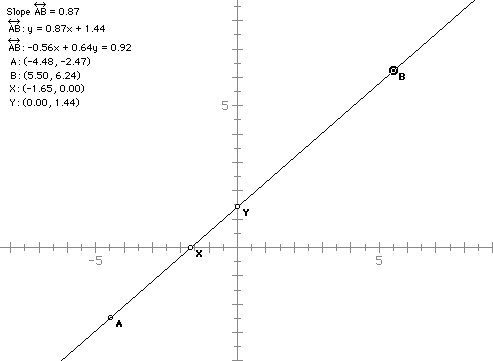
In this picture, X is the x-intercept and Y is the y-intercept. I have
provided the equation of the line AB in both Standard and slope-intercept
form.
EXPLORATIONS
1) Move the point B.
How does the coordinates of the x-intercept change? the y-intercept?
When are X and Y the same?
How do the equations of the lines change? Can you generalize this?
Do you see a connection between the two equations of the line AB?
2) Move the point A to the lower right-hand corner and the point B to the
upper left-hand corner. Answer the questions in the first exploration.
3) Move the point A to the origin (the point (0, 0)). Drag the point B.
As you drag B towards the x-axis, what do you notice about the slope of
AB and the equations of the line AB?
When the line is horizontal (What is the y-coordinate of B?), what happens
to the intercepts, the slope of AB, and the equations of the line? Can you
explain each of these?
As you drag B towards the y-axis, what do you notice about the slope of
AB and the equations of the line AB?
When the line is vertical (What is the x-coordinate of B?), what happens
to the intercepts, the slope of AB, and the equations of the line? Can you
explain each of these?
4) Summarize what you have learned in this exploration.
If you have GSP and would like to explore this set-up, click
here.

EXPLORATIONS
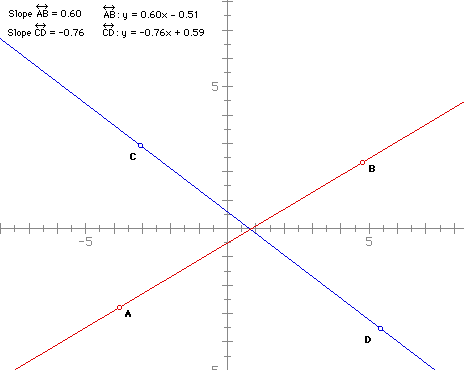
1) Move the lines around by dragging various points or the lines themselves.
Can you make any observations about the slopes of the two lines?
What happens when the lines are perpendicular?
What happens when the lines are parallel?
Can you make any conjectures?
If you would like to explore this screen, click
here.
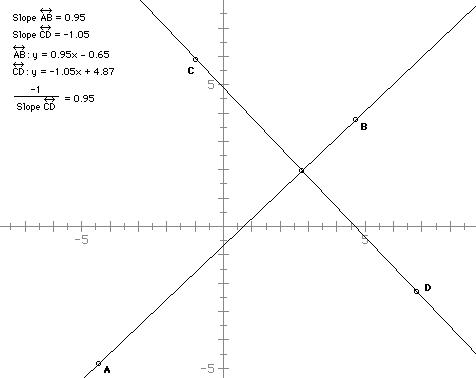
It is hoped that the students will make some sort of conjectures about the
nature of perpendicular lines. To test these conjectures, the following
screen might be used.

EXPLORATIONS
1) Drag the point B.
What do you notice about the equations of the two lines?
What do you notice about the slope of the two lines? (Use all the information
on the screen if necessary)
Since the two lines are perpendicular, what conjectures can you make about
the lines?
If you would like to explore this screen, click here.
It is hoped that the students will make some sort of conjectures about the
nature of parallel lines. To test these conjectures, the following screen
might be used.

In this particular case the lines are made so that the distance between
them remains the same as the point B is dragged. To change the distance
between them drag the point P on the line segment at the top.
EXPLORATIONS
1) Drag the point B
What do you notice about the slopes of the two lines?
What do you notice about the equations of the lines?
Is there a connection between the two y-intecepts in the picture? the two
x-intercepts?
What conjectures can you make about parallel lines?
If you would like to explore this situation and you have GSP, click
here.