
Investigate with different values of p
for k > 1, k = 1, and k < 1.
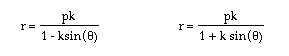
For notes on the derivations of these formulas, please see Dr Jim Wilson's page.
Let us begin by examining
for values of k > 1.
Let us view the graph in steps for k = 2, k = 4, k = 5, k = 7, and k = 10.
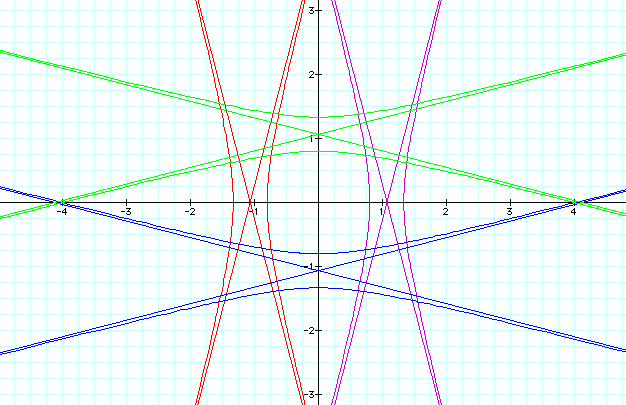
k = 2
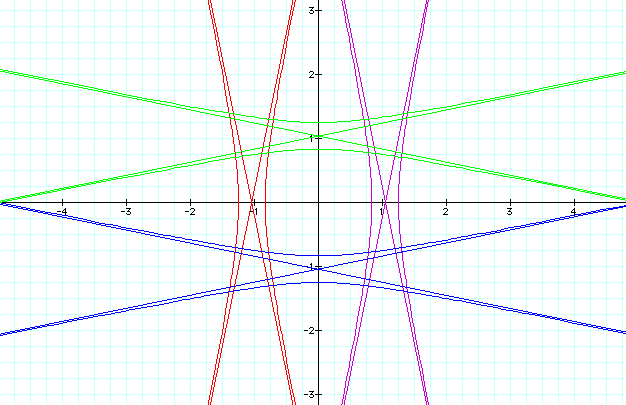
k = 4
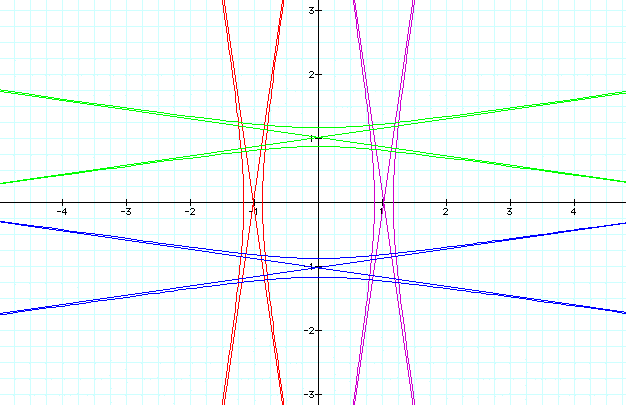
k = 5
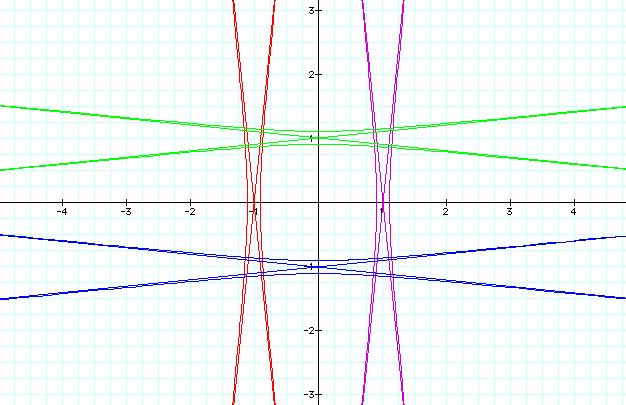
k = 7
k = 10
To view a movie of k moving from k = 2 to k = 10, please download the QuickTime file.
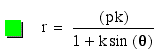
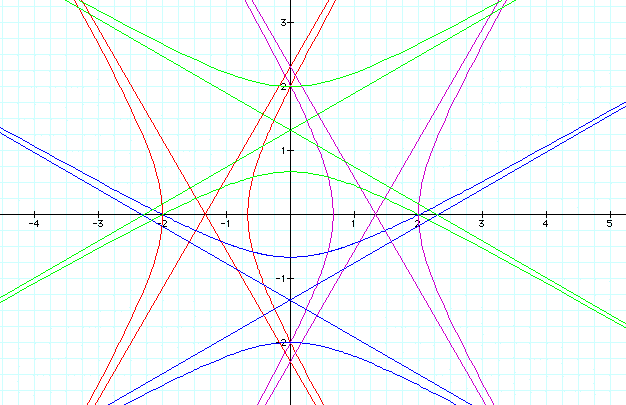
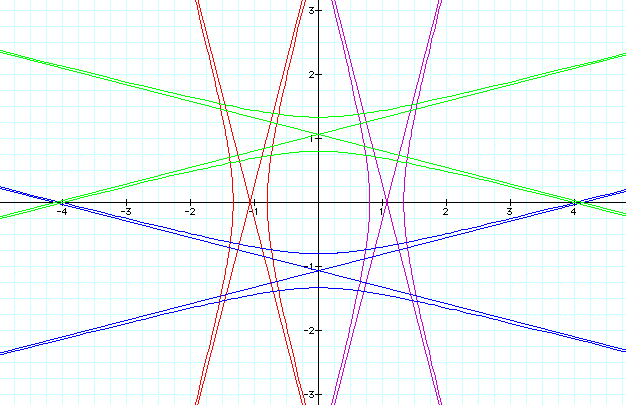
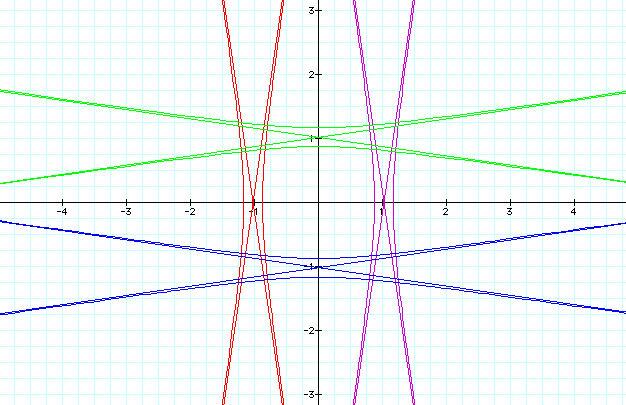
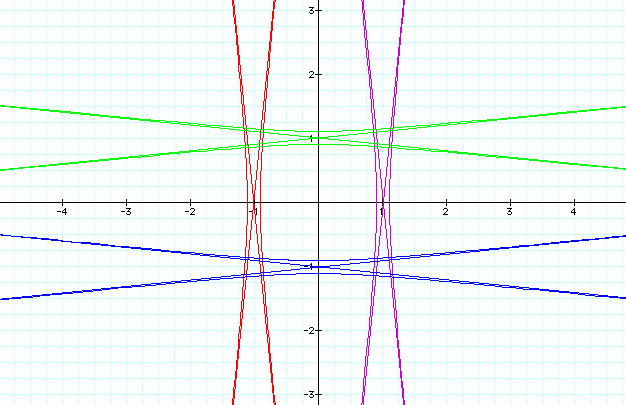
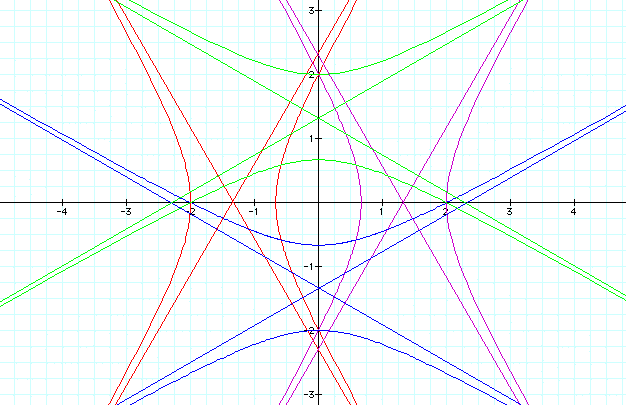
Notice that when k > 1, the graphs of r are hyperbolas, whose respective asymptotes are also illustrated.
Next, let us view when k = 1 for
k = 1
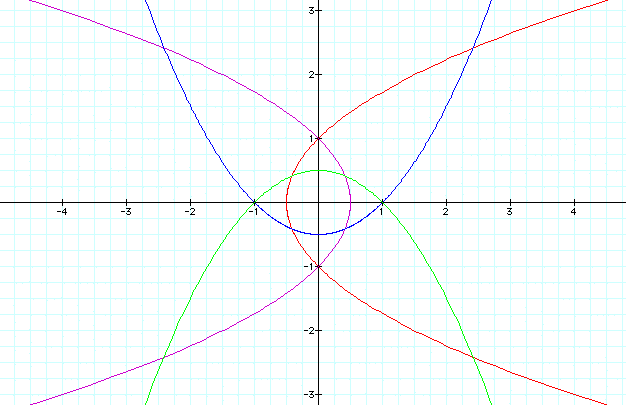
Notice that when k = 1 the graphs of r are parabolas.
Lastly, let us consider when k < 1 for
Let's view the graph in steps for k = -2, k = -4, k = -5, k = -7, and k = -10.
k = -2
k = -4
k = -5
k = -7
k = -10
To view a movie of k moving from k = -2 to k = -10, please download the QuickTime file.
Notice that when k < 1, the graphs of r are hyperbolas, whose respective asymptotes are also illustrated.
Do you observe anything else when k < 1, k = 1, and k >1? Do you see that there is symmetry presented in graphs in a multitude of ways? Notice for example
represented by red and purple, respectively, that these functions of r are reflected across the vertical axis. This is similar for
represented by blue and green, respectively, although they are reflected across the horizontal axis. Are there other forms of symmetry represented?
(In further exploration, it is also interesting to note that when 0 < k <1 (similarly for -1 < k < 0) that the graphs of r transition from parabolas to ellipsis to circles as k decreases. You can view this movement by downloading the QuickTime file.)