
By: Brooke Norman
Day 6
Graphing a Linear Equation Written in Slope-intercept Form
Objectives:
1- To learn what the slope-intercept form of a line is, be able to write the equation of a line in slope-intercept form, and be able to identify what the slope and y-intercept are for a given equation.
2- To be able to graph an equation written in slope-intercept form.
3- To learn what it means to have two parallel lines.
4- To be able to apply this new knowledge to other situations.
1- There are two main components to the slope-intercept form of a line: the slope and the y-intercept. Students should be familiar with both of these terms. The general equation of a line written in slope-intercept form is: y=mx+b, where m is the slope and b is the y-intercept. Now would be a good time to give students different slopes and different y-intercepts and have them write different equations of a line that fits this equation. For example: if the slope of a given line is 5, m=5, and the y-intercept is 3, b=3, what would the equation of the line be in slope-intercept form? Y= 5x+3. You can also give the students more examples in different forms and have them identify the different parts of it in slope-intercept form. For example: Identify the slope and y-intercept in the following equations:
a. 2x= 3y-6
b. y= 7x+2
c. 6y=2x-13
The answers are:
a. slope= 2/3 y-int= 2
b. slope= 7 y-int=2
c. slope=1/3 y-int= -13/6
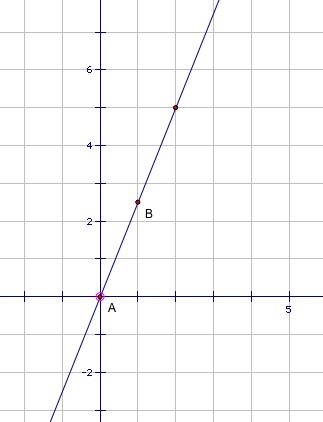
2- Now would be a good time to get out graphing calculators or other graphing software. It allows the students to graph and understand what happens when the slope and/or y-intercept changes. It is important to have the students do this on graph paper to get a visual of this for them. It is easy to explain this but difficult sometimes for students to understand it. Explain that it is key to plot the y-intercept first. This gives a good starting point. Students should realize that the y-intercept is not a single number, but an ordered pair, as learned in a previous lesson. The next step after plotting the y-intercept is to use the slope to find a second point. For example is the y-intercept is 3 and the slope is 2, then starting at the point (0, 3) a student would go up 2 units and over 1 unit. They would find that the new point would be (1, 6). They then would connect the two dots with a straight line. Give the students multiple examples for them to practice.
3- Ask the students, “What does it mean for something to be parallel?” Allow the students to discuss and ask for some examples they may want to share. The most common answer is two lines that never cross. Then pose the question of “Why do the two lines never cross or intersect?” After some more discussion, lead the students to realize that the reason the two lines never intersect is because they have the same slopes. This is another good time to use a graphing calculator or some other form of graphing software. Give some examples that have two equations with the same slopes, or m’s, but vary b. For example: graph y=3x+10 and y=3x-5. The results should be two separate lines that are parallel.
4- Now give the students a problem that they can use this new knowledge on. Here is an example:
a. Pretend you are at the beach and are looking at the tide chart. You notice that the tide comes in at a rate of 2.5 feet every half of an hour. If low tide is at its lowest at 12 noon and begins to come back in, what time will it be when the sea has come in 17.5 feet? If high tide is at its peak at 6:00 pm, how high did the tide reach on the shore? What time will the tide reach the next low tide if it ebbs at the same rate?
Have the students graph this problem with the x-axis representing time in half hour intervals, starting at 12 noon. The y-axis should represent the amount of movement of the tide in feet. A bit of a trick question would be to ask the students what the y-intercept is. Because it intercepts at 0, many students will not realize that 0 is the y-intercept.
When the tide is at 17.5 feet, it should be 3:30pm. This answer can be found by the mathematical equation of y=mx+b and substituting in to look like 17.5=2.5(x) +0. Or, it can be solved by looking at the graph where the x-axis is 17.5. The students need to remember that the intervals used on the graph are 30 minutes and not in hours. At 6:00 pm, the tide should be about 30 feet. Since we just found how high the tide gets, 30 feet, we can now use that to determine that it must ebb 30 feet. That means low tide should be at 12:00 am.
Return to the Instructional Unit Overview
Return to Brooke's EMAT 6690 homepage.