
By: Brooke Norman
Day 7
Solving Linear Equations by Graphing
Objectives:
1- To learn how to graphically solve a
linear equation
2- To use the graphing calculator to
aid in the learning of how to graphically solve a linear equation
1- The best way to explain this is by
working through examples and explain it as you go. Keep in mind that the end result is to have an equation in
slope-intercept form in order to graph it and find the solution. Suppose we had the equation of 4x + 6 =
14. The first step is to subtract
14 from each side in order to get 0 on one side. You should get 4x-8=0.
The next step is to substitute y in for the 0. Basically what you are saying is that y equals 0 and they
can be substituted for one another.
The new equation should read 4x-8=y. The student should be able to graph this equation based on
the knowledge they learned in the previous lesson. The y-intercept is -8 and the slope is 4. Using either pencil and graph paper or
a form of graphing software, the graph of this equation should look like the
following:
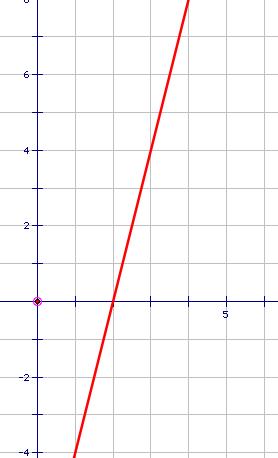
The
graph shows every possible x,y value that makes the statement true. There are indefinitely many points so
which one do we pick? If you go
back to the previous step, you will see that we have already set what our
y-value must be. (Remember
substituting y for 0?). When you
set y=0 and solve for x, that gives you the x-intercept or where the graph
crosses the x-axis. So, if we
solve the equation using y=0, we should get
0=4x-8
4x=8
x=2.
The graph of this equation should cross the x-axis at 2,
resulting in the point (2, 0). We
can check the answer by substituting the new x value into the original formula
of
4x +6 = 14
4(2) +6 =14
8+6=14
14=14
If the
students are still a little confused, here is a basic rundown of it:
-The
original equation given will not have a y variable.
-Write
the equation so that one side is equal to 0.
-Substitute
y in for 0. The equation should
now be in slope-intercept form.
This is able to be graphed.
You also must remember to set the y value equal to 0.
-Graph
the equation
-With
the equation set equal to 0, find the x-intercept. This is the solution to the problem and also where it
crosses the x-axis.
-Check
your solution in the original equation.
Many
examples should be worked because there are many steps and concepts the
students must understand. It is
very easy for them to get lost along the way. You may want to go into further details about why the
x-intercept is the solution.
2- This would be a great time to use a
graphing calculator. The example
used above was very nice, using nice integers and fractions. Real life uses will not be so easy;
neither will the ones in the text books.
Show the students how to type the equation into their calculator; it
must be in slope-intercept form for most graphing calculators. Then, show them how to use the “trace”
function to estimate the value of the x-intercept. An example would be 2.9(5x-6) +11.21-8.4x=x+3. This is a long and messy equation. If you move the x+3 to the left side,
you have set the equation equal to 0 and may plug it into the calculator to
graph its solution. For this example, the answer should be around 1.802, using
the graphing calculator’s trace function, you find that the x-intercept is
between 1.746 and1.9. Give your
students more examples and let the “play” around with technology.
Return to the Instructional Unit Overview
Return to Brooke's EMAT 6690 homepage.