
By: Brooke Norman
Day 8
Learning about Functions and
Relations
Objectives:
1-
Learn
to identify functions
2-
Learn
how to evaluate functions
3-
Learn
to graph linear functions
1-
We
first must know what a relation is.
In a mathematical sense, a relation is any set of ordered pairs. What does this mean? Say we have two different equations
that give us the following table of values:
|
x |
y |
|
1 |
5 |
|
2 |
7 |
|
3 |
9 |
|
4 |
11 |
|
x |
y |
|
1 |
2 |
|
2 |
4 |
|
3 |
2 |
|
4 |
6 |
In the above set of values, note
that they are both relations. They
both have sets of ordered pairs, or each input has an output. Each x value has a y value. One of the above sets of data is not a
function though. Take a look at
the first table and notice that each x value has a distinctive y value that
corresponds to it. No x value
shares a y value. In the
second table, this is not the case.
There is a number in the y column that is repeated twice, having two
different x values. The x value of
1 has a y value of 2 and also the x value of 3 has the value of 2. This is not a function. So, if each x value has a unique
corresponding y value, then the relation is a function.
The next way to determine if a relation
is a function is called the vertical line test. In order to do this, the student must first graph the
relation. So what now? If you can place a vertical line
anywhere on the graph and the vertical line crosses the graph in two or more
places, then the relation is not a function. If there is no place on the graph that a vertical line
crosses the graph in 2 or more places, then the relation is a function. Look at the following graphs and
determine which ones are functions and which ones are not. Use the vertical line test.
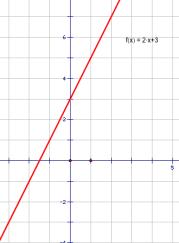
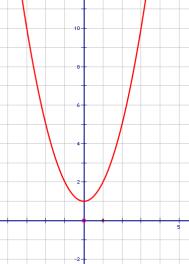
In the first and second graphs we
see that the relations are indeed functions. A vertical line only touches the graph at one point, no
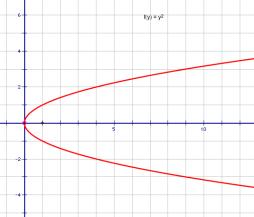
matter where it is placed. In the
third graph, the vertical line test fails. It touches the graph at more than one point, so it is not a
function.
2-
This
section of evaluating functions should be similar to what we have already
learned. If you go back to day 2,
we learned how to verify a solution.
We did this by substituting in x and y values and looking to see if that
ordered pair was a solution. We
also did a similar thing that day when we derived our table of values that we
then used to graph the equation.
The main difference is that we now will write the equation in the form
of f(x) =2x+6 instead of y=2x+6.
This is called function notation.
It helps the student to see that the solution, or y value, will be
dependent on what the x value placed in the equation is. Using the example of f(x)= 2x+6 the
student can evaluate the function for a given value of the variable, it now
becomes a substitute and solve problem. Have the students evaluate the function of f(x)= 2x+6
for x=1, x=3, x=4, x=5.
For x=1;
F(x)=2x+6
F(1)=2(1)+6
F(1)=2+6
F(1)=8
The proper way to read the answer
is: when the function is evaluated
for x equal to 1, the result is 8.
Have the students do the same steps
for the remaining x values.
3-
To
graph a linear function, the students follow the same steps as they learned on
day 6. They should first write the
equation in slope-intercept form.
Next, they should plot the y-intercept and use the slope to find the
second point. The student can
complete the graph by drawing a straight line through both points.
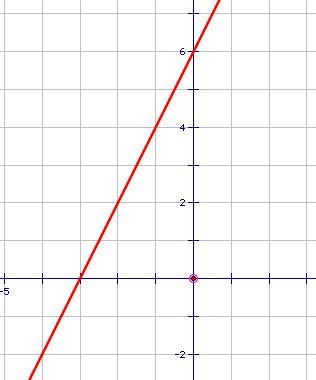
Here is an example
Graph the function of f(x)=6+2x.
First,
rewrite the equation in slope-intercept form
Y=2x+6
Plot
the first point, by using the y-intercept point in the equation
(0,6)
Use
the slope of 2 to find the next point.
Go up 2 and over 1 unit.
(1,
8)
Draw
a straight line through the two points and the graph is complete.
Return to the Instructional Unit Overview