Having created a geometric representation of the quadratrix, a next challenge might be to create an algebraic representation of this curve. To accomplish this task we turn to a little trigonometry.
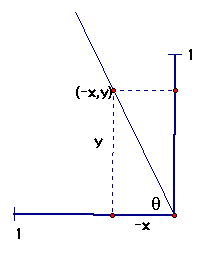
We'll begin by examining a particular instance in the sketching of the quadratrix curve. Check it out below.
We have (-x,y), a point on our curve and theta, the complement of the angle of rotation. To determine an algebraic representation, we will assume that the radius of our circle is 1.
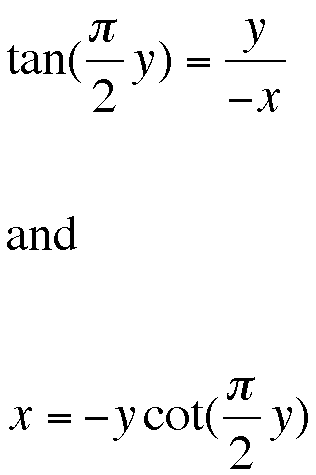
Relating x, y and theta is a relatively simple task which can be accomplished by incorporating the tangent ratio as follows:
However, our algebraic represnetation should only be a function of x and y. Consequently, we must find a way to represent theta in terms of x and y. To accomplish this goal, we turn to our knowledge of how the quadratrix is constructed.
A key feature of this curve is that the proportion of the right angle that has been swept out over a period of time equals the proportion of the segment [0,1] that has been covered. Consequently, the following proportion is true:
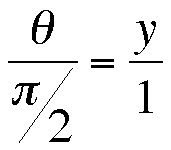
And so we discover that
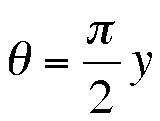
Using this information we can rewrite our equatio for the quadratrix as
Now that we have an equation candidate, let's take a look at a graph of this equation to see if it resembles the quadratrix curve we've seen before. Check it out below.
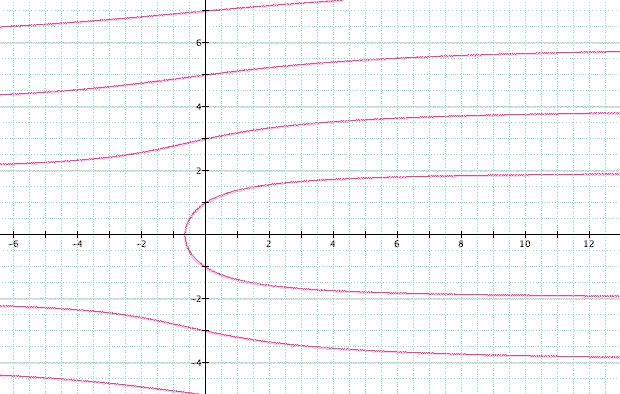
Hmmm . . . is this the graph we were expecting? There certainly seems to be a lot more happening in this graph than the rather simple curve we saw in our geometric representation. So, what's going on?
In developing an algebraic representation, we've left out a very important consideration of the range for our variables. Looking back at our original sketches, we see that the minimum value for y is zero. Additionally, the maximum value for y is the radius of the circle, in this case 1. Consequently, x ranges from -1 to 0. Thus we should actually only be examining the graph above on the following range: -1<x<0 and 0<y<1. Let's take another look at a graph of our function.
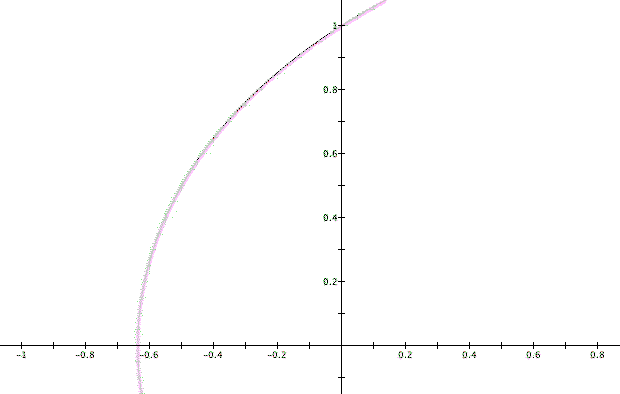
By zooming in on our graph we see a curve that looks very familiar - its the quadratrix!
Not surprisingly, the y-intercept of this curve
is (0,1). Perhaps more interesting is the x-intercept of the quadratrix.
What exactly is the point where this curve crosses the
x-axis? Click here to find out more.
Back to Quadratrix