
By
Victor L. Brunaud-Vega
|
|
Graph
|
|
||
|
|
If we give a range of values to t from 0 to 2π, then we have a longer
movement of the curve generating a circle with center in (0,0) and a radius
of 1. Given that my only variable is t, I would try to give it different
values and see what happens. |
|
||
|
|
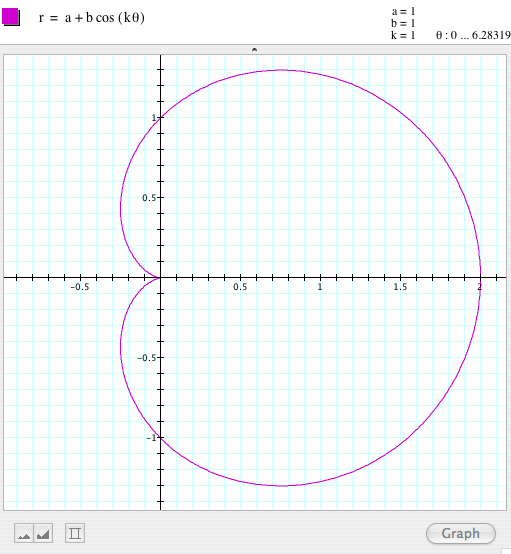
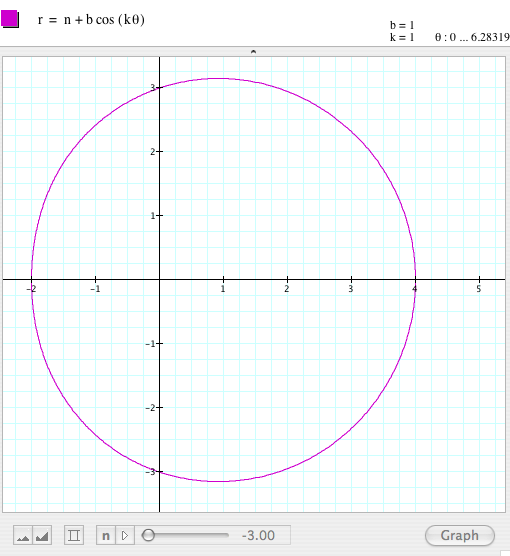
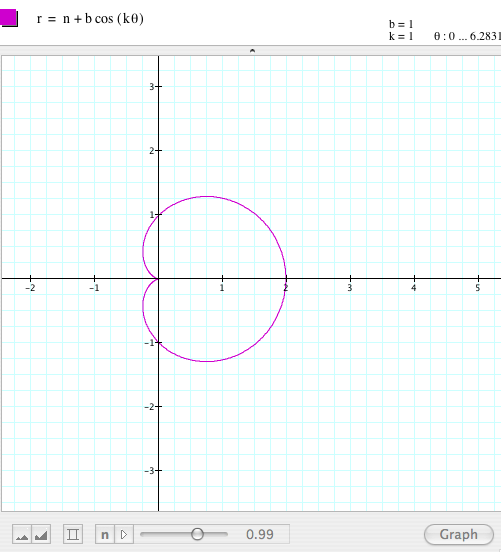
In order to explore other possibilities using this formula, I will add
two new parameters: x=cos (at) y=sin (bt) If I give different values to only one of the variables (a or b),
keeping the other with a value of one and t on the range of 0 to 2π.
To have an idea of the effect in the
graph because of the variances on the formula, these values should include at
least two even numbers, two odd numbers, a couple of fractional numbers and
all of them once in positive and once in negative form. This should be enough. Follow the sequence below, keeping a=1 and 0 < t > 2π, I selected graphs with
different values for b: |
|||
|
|
|
|
||
|
|
|
|
||
|
|
|
|
||
|
|
|
|
||
|
|
|
|
||
|
|
|
|
||
|
|
|
|
||
|
|
|
|
||
|
|
|
|
||
|
|
If it is still not clear, you can
watch the movement of the curve in this movie. |
|||
|
|
|
|
||
|
|
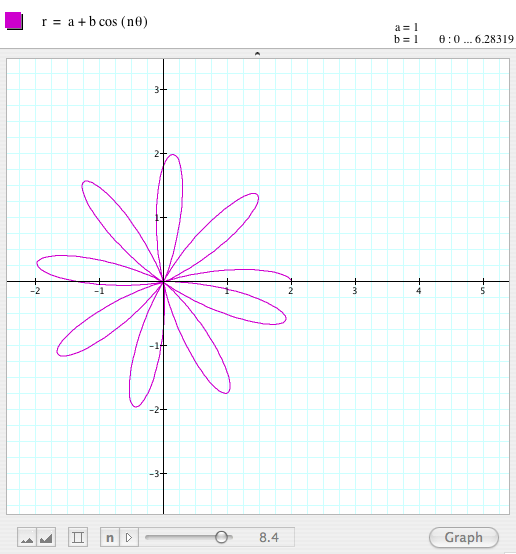
Now, let us keep b=1 and 0 <
t > 2π, and graph different
values for a: |
|||
|
|
|
|
||
|
|
|
|
||
|
|
|
|
||
|
|
|
|
||
|
|
|
|
||
|
|
|
|
||
|
|
|
|
||
|
|
|
|
||
|
|
|
|
||
|
|
|
It looks like the same kind of
movement but this time the line of symmetry is vertical (y axis). You can watch the entire movement of
the curve in this movie. |
||
|
|
|
|
||
|
|
|
|
||


|
|
