
The Department of Mathematics Education
J. Wilson, EMAT 6680
EMAT 6680
Assignment 3
Quadratic and Cubic
Equations
By Victor L. Brunaud-Vega
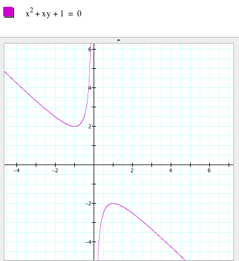
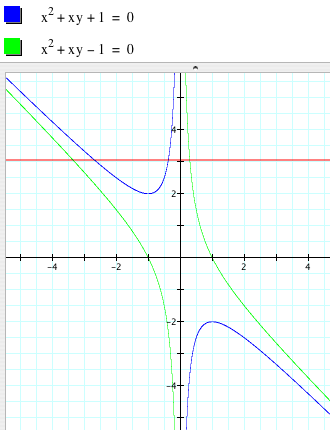
Let us try the equation x2 + bx +1 =0
In order to graph the equation using
the software Graphing Calculator, we must replace b and use y. Here is the graph where x=y=1.
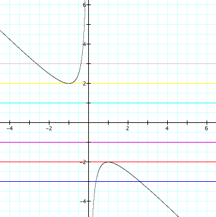
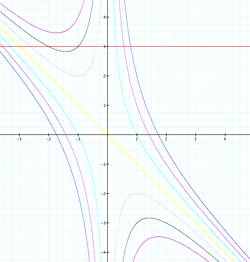
If we give a different value
to y, we are adding a line to the graph, parallel to the x axis, and possibly
intercepting the curves. The
picture shows graphs for different values of y, in this case -3, -2, -1, 0, 1,
2, and 3.
If the line intersects the curve in the xb plane, the intersection points
correspond to the roots of the original equation for that value of b.
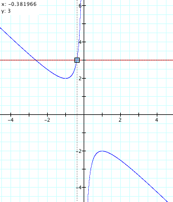
For each value
of y we get a horizontal line. In
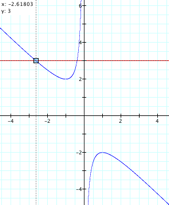
the graph, for b=y=3, we get two negative real roots of the original
equation:
x=-0.381966
and x= -2.61803
Another observation
is that there is no roots when the value of b=y is between 2 and -2.
Now, if we
change the value of c=1 to c=-1, the graph includes a new set of parabolas, as
you can see in the picture below.
So, what happens if we try different
values for c?
When the value of c=0, the curve
becomes a straight line and crosses the origin of the system (0,0).
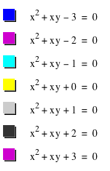
Now, what happens if 2x + b = 0? See the graph below.
According to this graph:
· For the
equation x2 + bx +1 = 0 we have two solutions: (-1,2) and (1,-2)
· For the
equation 2x + b = 0, if b=3 the line intersects the straight line parallel to
the x axis at (-1.5, 3)
|
|
