
Use the following exploration to generate a function to predict observed data.
(a) Take a cup of hot water and measure its initial temperature (time=0) and then record temperature readings each minute for 30 minutes. Make note of the room temperature.
(b) Enter the data on a spread sheet and construct a function that will model the data.
(c) Using the function predict the temperature after 45 minutes, 60 minutes, or 300 minutes.
(d) Calculate a measure of the error between your model and the observed data by taking the square of the difference for each time, sum the squares, and divide by the number of data points. You can se this statistic to guide refinement of you function to model the data.
I will use the following data.
ˇˇ
|
Time |
0 |
1 |
2 |
3 |
4 |
5 |
6 |
7 |
8 |
9 |
10 |
11 |
12 |
13 |
14 |
15 |
|
Temperature(ˇĆF) |
212 |
205 |
201 |
193 |
189 |
184 |
181 |
178 |
172 |
170 |
167 |
163 |
161 |
159 |
155 |
153 |
|
Time |
16 |
17 |
18 |
19 |
20 |
21 |
22 |
23 |
24 |
25 |
26 |
27 |
28 |
29 |
30 |
|
|
Temperature(ˇĆF) |
152 |
150 |
149 |
147 |
145 |
143 |
141 |
140 |
139 |
137 |
135 |
133 |
132 |
131 |
130 |
ˇˇ |
First, plot this data.
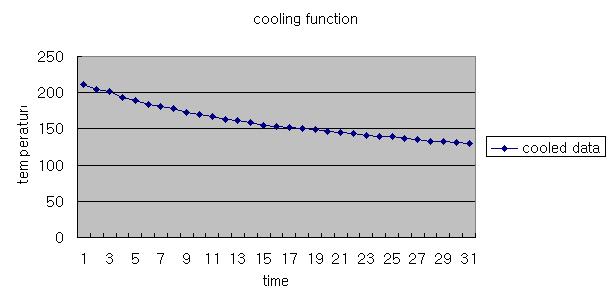
Our goal is to guess the temperature after 45 minutes, 60 minutes, or 300 minutes (without observation).
To achieve this, we need to find a function based on this data.
In mathematics, extrapolation is the process of constructing new data points outside a discrete set of known data points. On the other hand, interpolation is a method of constructing new data points from a discrete set of known data points, which is similar to the method of extrapolation.
Now, I will find a function of cooled data using the Maple software.
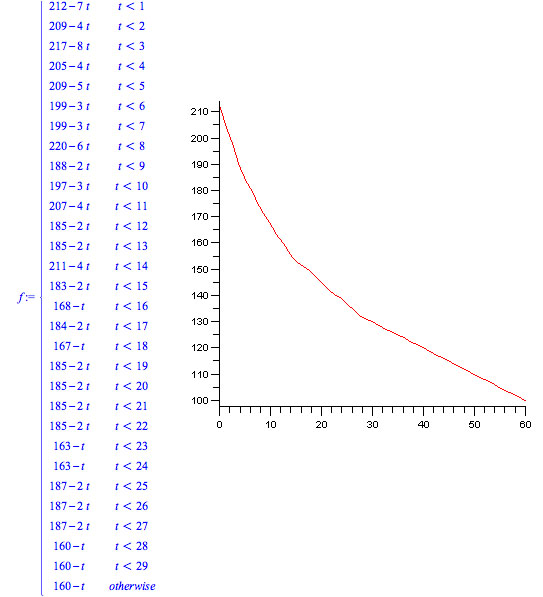
I used command, 'Spline' with linear in Maple, and found the function and graph. According to this function, we can see the temperature is decreasing by 1 degree per a minute after t = 30.
Return to Main Page
ˇˇ
ˇˇ
ˇˇ
ˇˇ
ˇˇ