
Construct graphs for the parabola
for different values of a, b, and c. (a, b, c can be any rational numbers).
How can we draw a graph of a quadratic function?
Explore the way to draw the graph as following steps.
< Step 1>
What does "a" mean?
Consider a graph of ![]() .
.
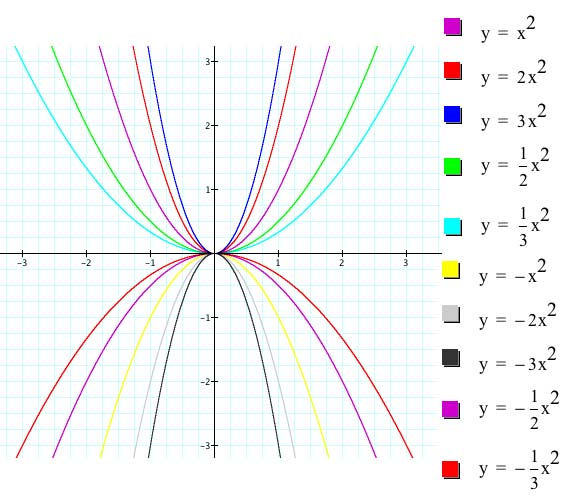
As you can see, the shape of the graph is parabola. If a>0, the parabola opens upward and the graph appears in the upper part(1st and 2nd quadrants) of a coordinate plane. On the other hand, if a<0, then the parabola opens downward and the graph appears in the lower part(3rd and 4th quadrants) of a coordinate plane. Moreover, the larger the value | a |, the narrower the width of a graph. In this graph, the vertex is (0, 0) and the maximum or minimum value is 0.
<Step 2>
Consider a graph of a function
![]() . Observe below file, and then what happens as the 'c'
changes?
. Observe below file, and then what happens as the 'c'
changes?

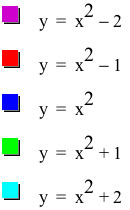
As 'c' increases, the graphs are going
up along y-axis; that is, the graph of function
![]() is to
translate
is to
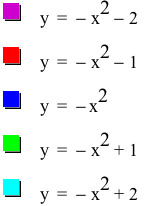
translate ![]() by 'c' along y-axis. Thus, the vertex is (0, c) and the minimum or maximum is c.
by 'c' along y-axis. Thus, the vertex is (0, c) and the minimum or maximum is c.
<Step 3>
Explore a graph of a function
![]() .
.
Here, the blue one is
![]() , and he
red one is
, and he
red one is ![]() .
.
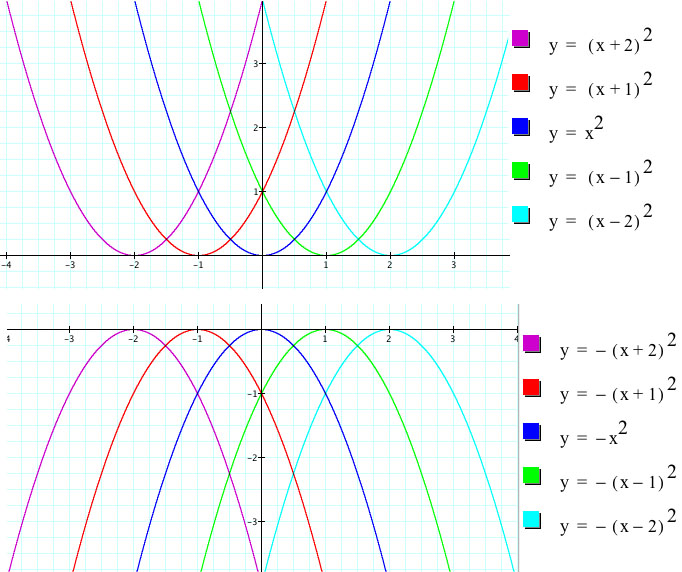
As 'p' changes, the graph
is moving along x-axis; that is the graph of the function
![]() is to
translate
is to
translate ![]() by 'p' along x-axis. Thus, the vertex is (p, 0) and minimum or maximum is 0.
by 'p' along x-axis. Thus, the vertex is (p, 0) and minimum or maximum is 0.
<Step 4>
Explore a graph of a function
![]() .
.
By <step 2> and <step 3>, its graph is
to translate ![]() by 'p' along x-axis first, and then to shift by 'q' vertically.
by 'p' along x-axis first, and then to shift by 'q' vertically.
For example, draw the graph of the
function ![]() .
.
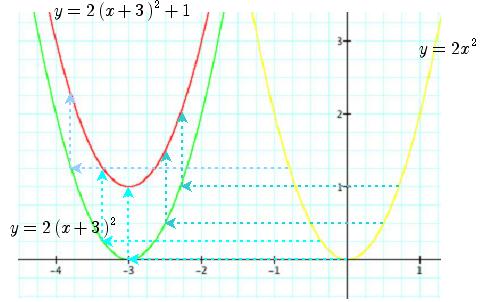
As you can see, we can get the graph through the following process.
First, draw the graph of
![]() , and then
shift the graph by -3 along x-axis, which is the graph of
, and then
shift the graph by -3 along x-axis, which is the graph of
![]() . Finally,
translate
. Finally,
translate
![]() by 1 along
y-axis, then we can get the graph of
by 1 along
y-axis, then we can get the graph of
![]() .
.
In the form
![]() ,
the vertex is (p, q) and minimum or maximum is q.
,
the vertex is (p, q) and minimum or maximum is q.
<Step 5>
Finally, consider a graph of a function
![]() .
.
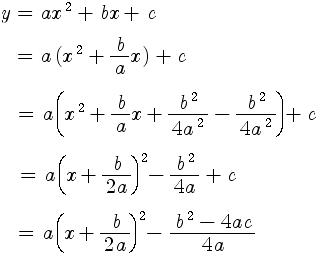
To use previous steps, we need to
transform the equation
![]() to of form
to of form
![]() using
the method of completing the square.
using
the method of completing the square.
Therefore, the graph of
![]() is to
translate
is to
translate ![]() by
by ![]() along
x-axis and by
along
x-axis and by
 along
y-axis.
along
y-axis.
Now, let's explore using following GSP file. To download the file, Click Here!
If you want to change the value 'a', 'b', and 'c', drag the points 'a' , 'b', or 'c'. Also, you can press action buttons.
Return to Main Page