
HamiltonHardison’s
Exploration of
Assignment 10: Lissajous Curves
From Jim
Wilson’sAssignment Page: Consider
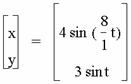
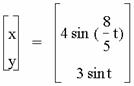
the parametric equations:
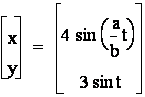 For 0 < t < 50.
Graph these for various values
of a and b. Describe fully. Compare with

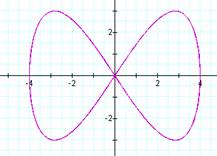
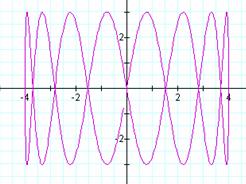
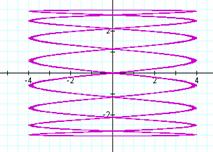
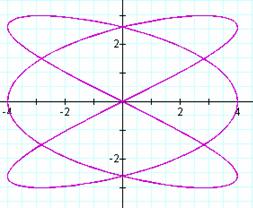
For an even integer b and a = 1, a pattern quickly
emerges. The number of loops in the
graph is equal to b. It also appears that the graph is bounded
horizontally between -4 and 4 as a result of ![]() . The graph is
vertically bounded between -3 and 3, since
. The graph is
vertically bounded between -3 and 3, since ![]() .
.

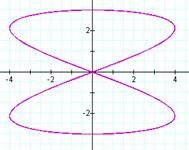


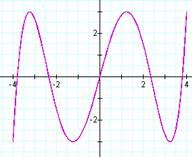
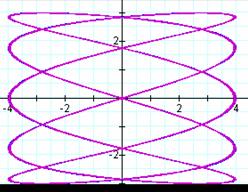
If a is an even integer and b
= 1, (the reverse of the previous cases), then the “rotation” of the above
cases occurs with the some dilation due to the different amplitudes. We might notice that, when a is even, the graph has a + 1 y-intercepts. When b
is 1, we have 1 x-intercept.
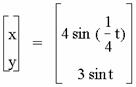
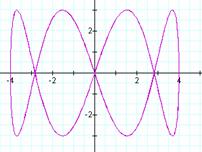
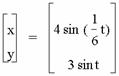
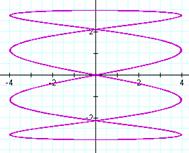
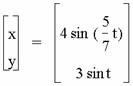
For odd unit fractions, we
have


We have a slightly different
pattern occurring with the number of intercepts. It appears that when a is one we have one y-intercept as expected; yet when b is odd we have b intercepts rather than b+1
intercepts as was the case above.
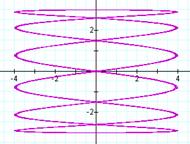
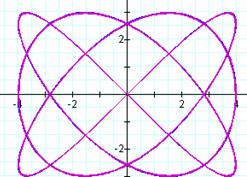
By examining more interesting
combinations:

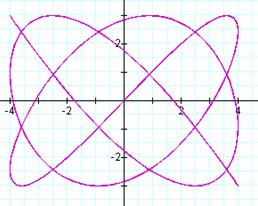

It seems that a
determines the number of y
intercepts. If a is odd, then there are a-y-intercepts. If a
is even, there are a + 1
y-intercepts. If b is odd, then there are b
x-intercepts. If b is even then there are b+1
x-intercepts. It also appears that an
even value for a or b results in a closed loop graph,
whereas two odd values result in a graph that has “ends”.
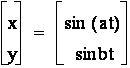
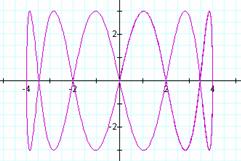
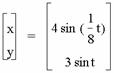
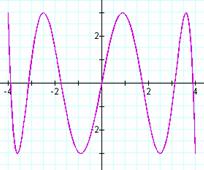
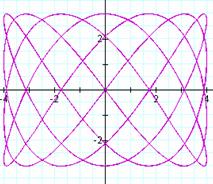
It appears that the graphs of
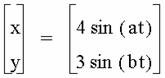 are equivalent to the graphs of
 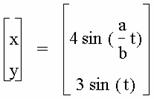 .
.
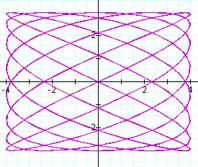
Overlays are shown for (a,b)
= (3,4); (5,2); and (7,9)
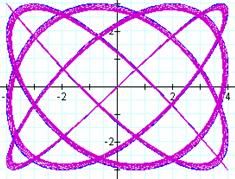
For some reason, the quality
of graph seems to be reduced in the second set of graphs due to the manner in
which the calculator handles the expression.
I’m guessing that the t-step
is too large to gain the needed precision.
Returnto Hamilton Hardison's Page