
HamiltonHardison’s
Exploration of
Assignment 2: An Exploration of a Quadratic Relation
From Jim Wilson’s Assignment
Page: Graph ![]() . Now, on the same axes, graph
. Now, on the same axes, graph ![]()
Describe
the new graph. Try different coefficients for the xy term. What kinds of graphs
do you generate? What coefficients mark the boundaries between the different
types of graphs? How do we know these are the boundaries? Describe what happens
to the graph when the coefficient of the xy term is close to the boundaries.
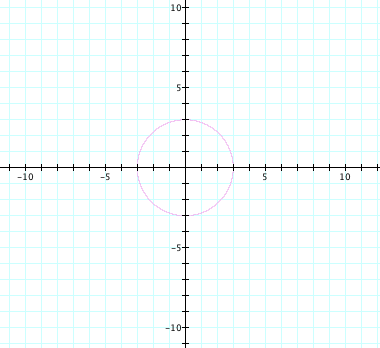
It is clear that the graph of ![]() is a circle.
is a circle.
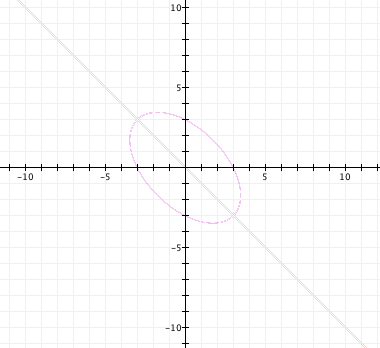
Graphing ![]() gives an ellipse whose major axis
appears to be on the line
gives an ellipse whose major axis
appears to be on the line ![]() .
.
By graphing ![]() for n = .2, .4, .6, … , 1.6, 1.8, We see that we have a series of ellipses. Each has it’s major axis lies along the
line
for n = .2, .4, .6, … , 1.6, 1.8, We see that we have a series of ellipses. Each has it’s major axis lies along the
line ![]() . As n increases, the ellipse becomes longer and thinner.
. As n increases, the ellipse becomes longer and thinner.
When n=2, we have a very different graph.
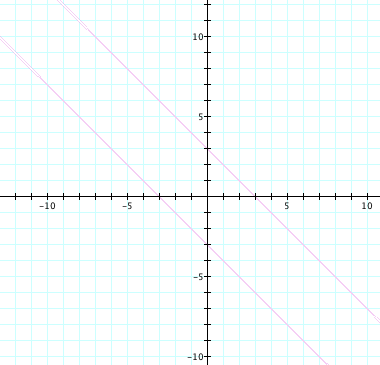
This appears to be two parallel lines.
Algebraically we have: ![]()
By solving for (x+y); We have ![]() or
or ![]() . This confirms the conjecture that the
graph is no longer an ellipse, but two parallel lines.
. This confirms the conjecture that the
graph is no longer an ellipse, but two parallel lines.
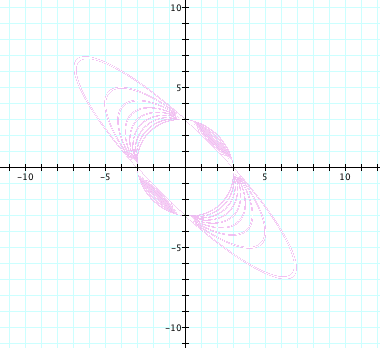
As the coefficient of the xy term moves beyond 2; we
notice a different class of graphs. The graph of ![]() for n = 2.2, 2.4, 2.6, … , 3.6, 3.8 is shown below.
for n = 2.2, 2.4, 2.6, … , 3.6, 3.8 is shown below.
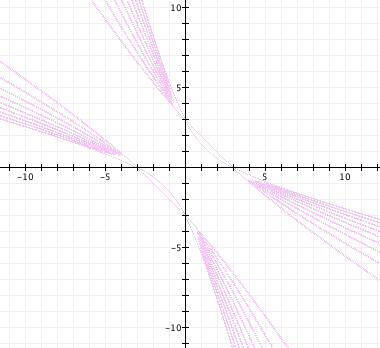
Each curve appears to be a hyperbola whose foci lie
along the line ![]() . As n gets further away from 2, the curvature of the graph
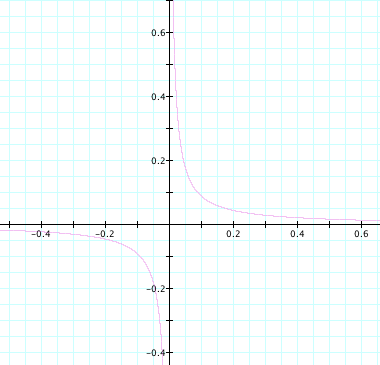
becomes more exaggerated. By examining
the graph of
. As n gets further away from 2, the curvature of the graph
becomes more exaggerated. By examining
the graph of ![]() , we can
somewhat safely determine that all coefficients of the xy term greater than 2
will produce hyperbolas. (Note the
difference in scale)
, we can
somewhat safely determine that all coefficients of the xy term greater than 2
will produce hyperbolas. (Note the
difference in scale)
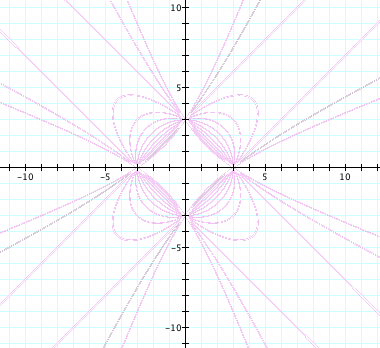
If negative values are
considered, the results can be summarized in the graph and table below:
|
n<-2 |
Hyperbola |
|
n=-2 |
Parallel Lines |
|
-2<n<0 |
Ellipse |
|
n=0 |
Circle |
|
0<n<2 |
Ellipse |
|
n=2 |
Parallel Lines |
|
2<n |
Hyperbola |
Returnto
Hamilton Hardison's Page