
Transformations of the Sine and Cosine Graph
– An Exploration
By Sharon K. O’Kelley
This is an exploration for
Advanced Algebra or Precalculus teachers who have introduced their students to
the basic sine and cosine graphs and now want their students to explore how changes
to the equations affect the graphs.
This is an introductory lesson whose purpose is to connect the language
of Algebraic transformations to the more advanced topic of trignonometry. (A key follows the end of the
exploration.)
1. Consider the basic sine equation and graph. Let’s
call it the first function….
![]()
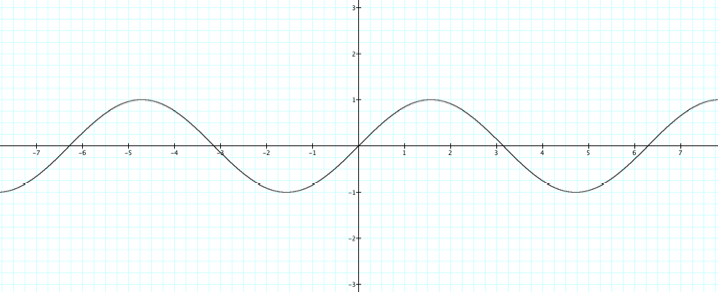
2. If the
first function is rewritten as….
![]()
then the values of a = 1, b = 1, and c = 0.
Let’s find out what happens
when those values change….
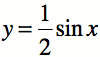
3. Take a
look at the blue and red graph and their equations. The graph of the first
function remains in black.
Equation of blue graph
![]()
Equation of red graph
a.
Describe how the equation of the first function has changed to become
the equation of the graphs in blue and red. This value is called the amplitude of the graph.
b.
Describe how the graph of the first function has changed to become the
blue graph and the red graph. Be as specific as possible. Include in your
answer how a specific point on the graph of the first function transforms to
become a point on the blue graph and on the red graph.
c. Take a look at an animation of this
phenomenon. Click here…. (Be
patient. These movies take awhile
to load….)
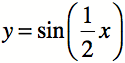
4. Now
consider the purple and green graph and their equations. The graph of the first
function remains in black.
Equation of purple graph
![]()
Equation of green graph
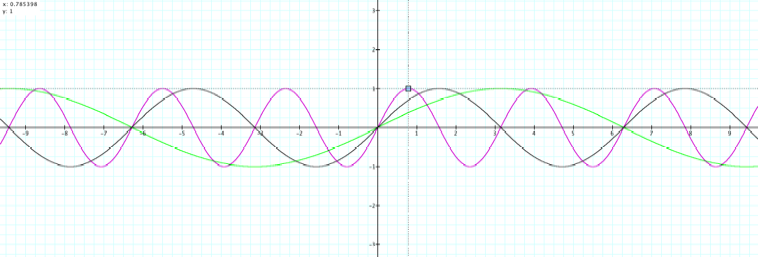
![]()
a. Describe how the equation of the first function has changed
to become the equation of the graphs in purple and green.
b. Describe how the graph of the first function has changed to
become the purple graph and the green graph. Be as specific as possible. Include
in your answer how a specific point on the graph of the first function
transforms to become a point on the purple graph and on the green graph.
c. How does “b” operate differently
from “a” in the equation? Look deeper than horizontal versus vertical….
d. Take a look at this phenomenon….
Click here….
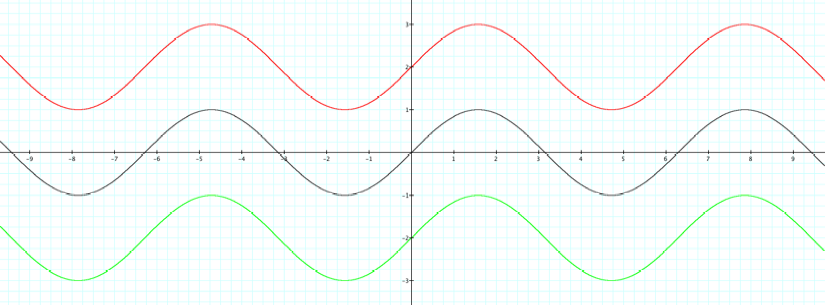
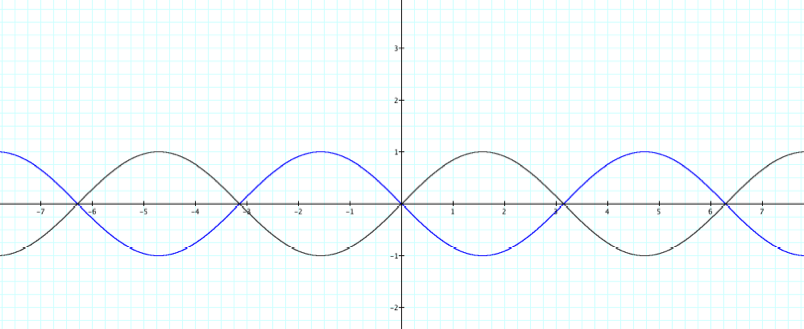
5. Examine
the purple and green graph and their equations. The graph of the first function
remains in black.
Equation of red graph
![]()
Equation of green graph
![]()
![]()
a.
Describe how the equation of the first function has changed to become
the equation of the graphs in purple and green.
b.
Describe how the graph of the first function has changed to become the
red graph and the green graph. Be as specific as possible. Include in your
answer how a specific point on the graph of the first function transforms to
become a point on the purple graph and on the green graph.
c.
See how it moves…. Click here….
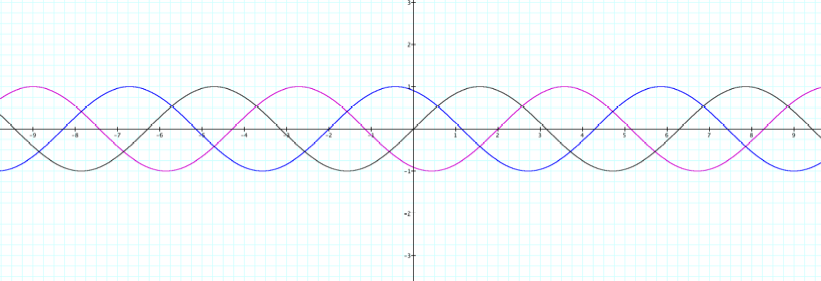
6.
Consider the blue and purple graph and their equations. The graph of the
first function remains in black.
This value is called the phase shift of the graph.
Equation of blue graph
![]()
Equation of purple graph
![]()
![]()
a. Describe how the equation of the first function has changed
to become the equation of the graphs in blue and purple.
b. Describe how the graph of the first function has changed to
become the blue graph and the purple graph. Be as specific as possible. Include
in your answer how a specific point on the graph of the first function
transforms to become a point on the blue graph and on the purple graph.
c. How does “c” operate differently
when it is inside or outside the parentheses? Look deeper than horizontal
versus vertical….
d.
Take a look…. Click here….
7. What
about negatives?
a. Examine the following graphs…. (The
first function is in black.)
Equation of red graph
![]()
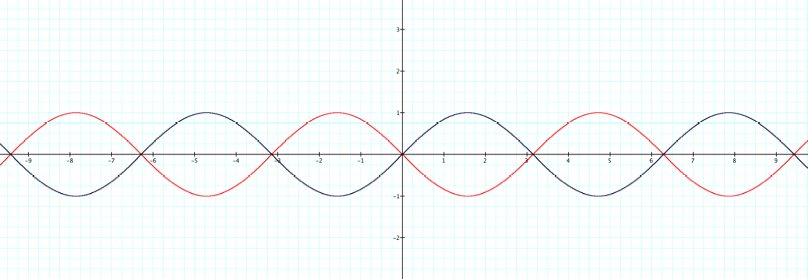
Equation of blue graph
![]()
b. Compare the graphs.
Describe in detail the transformations you see.
8. Throwing
it all together….
Consider the graph of ….
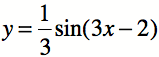
(The first function is in black.)
Describe the transformations fully. Be as specific as possible.
(Hint: Look at this problem
as  .)
.)
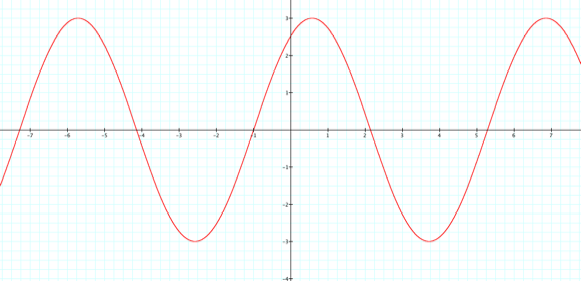
9. The Cosine Graph
![]()

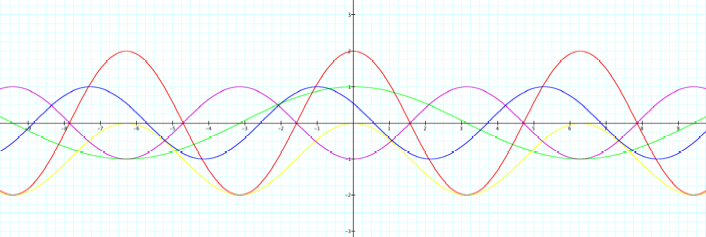
a. On a sheet of graph paper, predict what the following graphs
would look like.
![]()
![]()
![]()
![]()
10. Let’s go a little further…. Write two different equations for the
same graph below. Use sine in one
and cosine in the other. Verify your answer with graphing software or a
graphing calculator.
11. Summarize
what you have learned here. Use
definitions and examples. Be
specific.
Key to the Exploration
3. a. The
value of “a” is 2 and ![]() .
.
b. The blue graph is stretched vertically
by a factor of 2. This can be
determined by comparing point (1.57, 1) on the first function to point (1.57,
2) on the blue graph. The red
graph is shrunk vertically by a factor of ![]() . This can be determined by comparing point (1.57, 1) on the
first function to point (1.57,
. This can be determined by comparing point (1.57, 1) on the
first function to point (1.57, ![]() ) on the
) on the
red graph.
4. a.
The value of “b” is 2 and ![]() .
.
b. The purple graph is shrunk horizontally
by a factor of ![]() . This can be
determined by comparing point (1.57, 1) on the first function to point (0.785,
1) on the purple graph. The green
graph is stretched horizontally by a factor of 2. This can be determined by comparing point (1.57, 1) on the
first function to point (3.14,1) on the green graph.
. This can be
determined by comparing point (1.57, 1) on the first function to point (0.785,
1) on the purple graph. The green
graph is stretched horizontally by a factor of 2. This can be determined by comparing point (1.57, 1) on the
first function to point (3.14,1) on the green graph.
c. The values for “a” and “b” seem to be
inverted. In other words when “a”
is ![]() it is a vertical
shrink by
it is a vertical
shrink by ![]() . When “b” is
. When “b” is ![]() , however, it is a horizontal stretch by a factor of 2. This can easily be explained by the
fact that you are solving, so to speak, for the given variable. For example,
, however, it is a horizontal stretch by a factor of 2. This can easily be explained by the
fact that you are solving, so to speak, for the given variable. For example, ![]() is equivalent to
is equivalent to
![]() ; therefore, when the variable is isolated it seems
straightforward. However, the x
isn’t isolated in these cases….
; therefore, when the variable is isolated it seems
straightforward. However, the x
isn’t isolated in these cases….
5. a.
The value of “c” is 2 and ![]() .
.
b. The red graph is translated up by 2
units. This can be determined by comparing
point (0,0) on the first function to point (0, 2) on the red graph. The green graph is translated down by 2
units. This can be determined by
comparing point (0, 0) on the first function to point (0, ![]() ) on the green graph.)
) on the green graph.)
6. a. The value of “c” is 2 and ![]() .
.
b.
The blue graph is translated left
2 units. This can be
determined by comparing point (0,0) on the first function to point ![]() on the blue
graph. The purple graph is
translated right 2 units. This can
be determined by comparing point (0, 0) on the first function to point (2,0) on
the purple graph.
on the blue
graph. The purple graph is
translated right 2 units. This can
be determined by comparing point (0, 0) on the first function to point (2,0) on
the purple graph.
c.
Outside the parentheses, positive c is up and negative c is down. Inside, it seems opposite than what you
would assume. Positive c is to the
left and negative c is to the right.
7. They
look the same! Why? Because sine
is a periodic function, a vertical reflection and horizontal reflection yield
the same image.
8. The
graph has translated right ![]() units. It has
been horizontally shrunk by a factor of
units. It has
been horizontally shrunk by a factor of ![]() and vertically
shrunk by a factor of
and vertically
shrunk by a factor of ![]() .
.
9. *![]() (red)
(red)
*![]() (blue)
(blue)
*![]() (purple)
(purple)
* (green)
*![]() (yellow)
(yellow)
10. Possible
answer: ![]() and
and ![]()
11. Students’ answers should cover definitions and
descriptions of the transformations as well as how the generic equation
changes. They also should define
“amplitude” and and “phase shift.”