
Translations of the Quadratic Function
– An Exploration
By Sharon K. O’Kelley
This
is an exploration for Algebra or Advanced Algebra teachers who want their
students to explore how changes to a quadratic equation affect the graph of the
parabola. This exploration focuses on the vertex form of the quadratic
equation. (A key follows the end of the exploration.)
1.
Consider the graph….
![]()
Let’s call this the
graph of the “first function.”
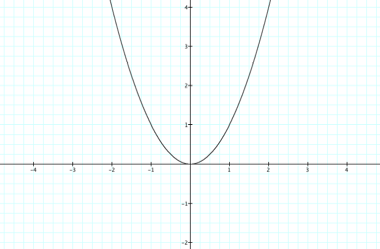
The vertex is__________.
2.
Now, let’s change the first function….
![]() .
.

Compare the red graph with the
original one. Describe the change and state the new vertex.
3.
Now, ponder this change….
![]()
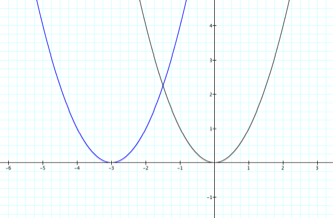
Compare the blue graph with the
original one. Describe the change and state the new vertex.
4. Do you want to see an animated
version of what is going in questions 2 and 3? Go here. (Be patient. It takes awhile to
load….)
5. For the next part, we are going to
hold “a” constant at 1 and vary “b.” Consider the following functions and their
graphs.
![]() (black)
(black)
![]() (blue)
(blue)
![]() (red)
(red)
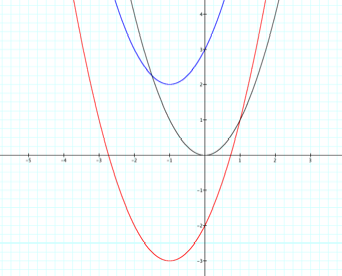
Compare the blue and red graphs with
the original one. Describe the changes and state the new vertices.
6.
See an animation of these transformations. Click here.
7. Sketch what you think the following
graphs will look like…. (Be sure to note your vertices.)
![]()
Go here
to see the answer.
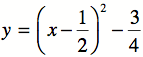
8. Write the equation of the graph.

Equation:__________
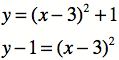
9. Compare the two given functions. Will
they yield the same graph? Justify your answer.
10.
Do these changes affect the shape or position of the first function?
11. Experiment
on a graphing calculator or with graphing software and provide an example of a
function which changes the shape of the parabola.
Function:__________________
12.
Describe the transformations you have explored in this lesson. Connect what is
going on in the equation with what you see in the graph.
13.
Use what you have learned to write the equation for the red graph. Its original
graph is given in black.
Original Equation: ![]()

Equation of red graph:___________
Key
1. (0, 0)
2. The parabola has translated to the
right two units and its new vertex is (2, 0).
3. The parabola has translated to the
left three units and its new vertex is (-3, 0).
5. The blue parabola has translated left
1 unit and up 2 units. The new vertex is (-1, 2). The red parabola has
translated left 1 unit and down 3 units. The new vertex is (-1, -3).
8. ![]()
9. They do yield the same graph because
the functions are equivalent. If 1 is subtracted from both sides in the first
function, it becomes the second function.
10.
These are translations which means they only change the position of the graph
horizontally or vertically. The shape of the parabola does not change.
11.
An example of a graph in which the shape of the parabola would change is ![]()
12.
The graph of the parabola translates right a units when the function includes ![]() and left a units when the function includes
and left a units when the function includes ![]() . The graph translates up b units when the function has +b on
the outside of the parentheses and down b units when it has –b. If b is
on the same side of the equation as y, then the vertical translation follows
the same pattern as the horizontal – e.g., +b would be down b units.
. The graph translates up b units when the function has +b on
the outside of the parentheses and down b units when it has –b. If b is
on the same side of the equation as y, then the vertical translation follows
the same pattern as the horizontal – e.g., +b would be down b units.
13. ![]()