
Varying ‘b’ in the Standard Quadratic Equation
By Sharon K. O’Kelley
I. Consider the quadratic equation in standard form…
![]()
Let’s examine graphs of a quadratic equation in which
“a” and “c” are held constant and “b” is varied.
In the figure below, the beginning equation is…
![]()
and “b” is varied.
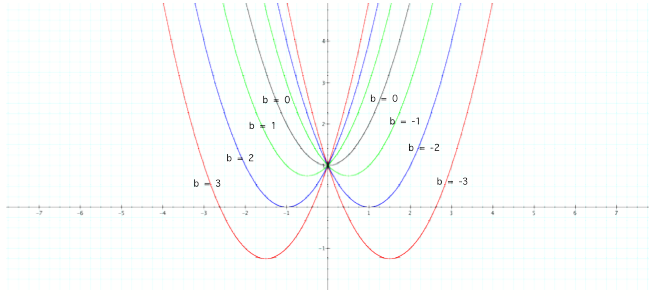
From the graphs, you can draw
several conclusions….
1. When “b” is -3 and 3, the
parabolas intercept the x-axis in two places each. In other words, each
parabola has two zero’s or
two real solutions. These can be found by
setting the equation equal to 0 and solving for x. For example….
 (Solved using the
Quadratic Formula.)
(Solved using the
Quadratic Formula.)
2. When “b” is -2 and 2, the
parabolas touch the x-axis in one place each. In other words, each parabola has
a double zero or
one real solution. It is called a double zero in
that each equation can be factored into identical parts. For example….
3. When “b” is -1 and 1, the
parabolas do not touch nor intersect the x-axis; therefore, there are no zeros
and hence no real
solutions as demonstrated below….
4. When “b” is 0, the graph does
not touch nor intercept the x-axis; therefore, there is no real number solution
to the
corresponding equation. In addition, when “b” is
0 the equation becomes…
![]()
When viewed in vertex form, the equation becomes…
![]()
From the above equation, the vertex can easily be identified
as (0, 1).
II. Next, let’s find the vertices of each of the graphs using
the vertex formula for quadratic equations in standard form….
The work will be given for the first
problem only….
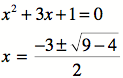
* If
b = 3….
![]()

Therefore, the vertex is
(-1.5, -1.25).
Summary:
|
Equation |
Vertex |
|
|
(-1.5, -1.25) |
|
|
(1.5, -1.25) |
|
|
(-1, 0) |
|
|
(1, 0) |
|
|
(-0.5, 0.75) |
|
|
(0.5, 0.75) |
|
|
(0, 1) |
III. Next, consider…
![]()
graphed in purple with the other graphs below.

A hypothesis suggested by the figure
is that the graph of the purple parabola contains the vertices of the other
parabolas.
This can be verified with a table of
values for…
![]() .
.
|
x |
y |
|
-1.5 |
-1.25 |
|
-1 |
0 |
|
-0.5 |
0.75 |
|
0 |
1 |
|
0.5 |
0.75 |
|
1 |
0 |
|
1.5 |
1.25 |
Also, notice that the purple
parabola is a reflection of the graph whose “b” is 0.

Thus, it can be stated that
the reflection of a graph of a quadratic equation in which “b” is 0 will
contain the vertices of
the parabolas created when “b”
is varied and “a” and “c” are held constant in the original equation.
Example:
If the hypotheses is true, then…
![]()
should be the reflection of…
![]()
and should contain the vertices of the parabolas created
when only “b” is varied in the original equation.
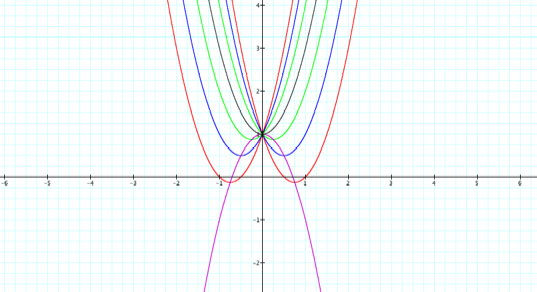
Red: b = -3, 3
Blue: b = -2, 2
Green: b = -1, 1