![]()
J HOUSE MEDIA
![]()
J HOUSE MEDIA
J House Media is a website development company that was developed in 2003 by a group of college friends. The company, which has grown and now houses about 15 employees, helps businesses from the Athens, GA area set up websites on the internet. Math is used everywhere in the business and for this field trip of math in the world I have chosen to concentrate on companies profit gain and loss.
Before students starts this lesson they should be very knowledgeable in algebra and linear functions. They should know how to graph linear functions in the form of y=mx+b, whether it be by hand or on a program such as graphing calculator or GSP. Students should also have an understanding of how to read data charts.
During the field trip to J House Media students will learn the process behind the making of a website. J House Media has a series of steps that each website goes through in order to be complete the final website. While there, the students will learn about each process and what is involved in each step.
When a company is interested in using J House Media to develop a website for their business they first set up an initial consultation, which is free, and it gives the client the opportunity to ask any questions they may have about the process of building the website. This meeting also gives the Business Development Director of J House Media the chance to learn what the client is interested in and what the company for which they are going to develop the website for does.
Now begins the series of four steps that every website goes through before being completed.
First is the collaboration team. They take what was learned in the initial set up meeting and develops a plan for the website and creates a table of what needs to be included in the final website. After the initial meeting and the created blueprint for the website, an Architecture Presentation is held between the Business Development Director and the client. In this meeting the breakdown of the website is presented to the client. It is then that the client will know what the price will be for their website and how long it will take to create. After the client has signed the contract to develop a website a team meeting is to inform the rest of the company about the new project.
Second is the design team.
Here, the employees work with the client to find out what the client wants the website to look like and what all they have in mind for their website.
Third comes the programming step where the company will program the website and put it on the Internet.
Fourth and finally the debugging process begins. Depending on the size of the website, several people will review the website before giving it to the client. They will go through each page and link and make sure that they all work. If a bug is found, the problem will be sent to a programmer or designer and they will fix it. This is the final process before giving the website to the client. After all of this is complete the company then hands over the website to the company. A program called TigerAdmin, allows the client to manage the content of the their website. At this point the client puts their content on the website and then also looks on each page to see if there are any other bugs that were not previously found. After all of this is done the project is complete and the website is officially online and running.
J House Media uses a series of charts to keep up with the hours worked on the website so that they will know how much to charge a client. They initially charge $95 per hour and they also have a $500 charge for the software that they use in the development of the website. When a client comes J House Media each department decides how long it should take them to complete their part of the project. They then take the total number of hours and multiply it by 95 and then add on the 500 for the software and that it the total price of the website.
For example take a look at the chart.
| hours | |
|---|---|
| Collaboration team | 4 |
| Design team | 3 |
| Programming team | 8 |
| Debugging team | 2 |
Given the following chart can you find out how much they should charge their client? We would add up all of the hours then multiply it by 95 and add on the 500. So we would have,
(4+3+8+2)95+500=17(95)+500=1615+500=2115. So J House Media should charge their client $2115 for their website.
With all of these calculations we can develop a linear equation to develop the price of the website. The format that we use to find the linear equation is y = mx + b. Since we know that the starting price for a website is always going to be $500, we can say that 500 will be our y-intercept. Next we know that for one hour of work, the company charges $95. Therefore the slope of the equation will be 95. Now we substitute the numbers into y = mx + b and we get that the equation is y = 95x + 500, where x is the number of hours. We now can plot this graph and predict the different costs for a website for the amount of hours worked on it.
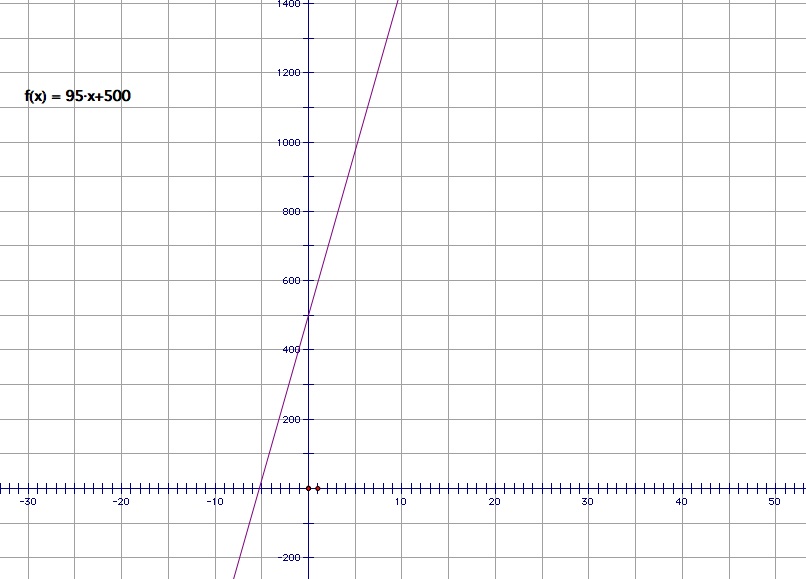
Looking at the graph we can estimate the cost amount of a website based on how long it took to develop.
Like stated before, before each website the teams decide how long they predict it will take them to work on the website and then give the client a price for the website. What happens when a team goes over or under their predicted amount of hours? This is where profit gain and loss comes in. We can use the same equation but drop the initial 500 because we know that no matter what we will get that profit and for this purpose we want to know strictly how much was gained or lost based on hours. To calculate the gain or loss of a website we would take the predicted amount of hours and subtract it from the actual amount of hours.
For example say we predicted that it would take 6 hours but it actually took 4 hours, this way we have a gain of 2 hour where the company will have extra profit. In another case say that the company predicted it would take 7 hours to complete the website and it ended up taking 10 hours. This time we have a loss of three hours.
So our new equation would be
y=95(predicted hours-actual hours)
Let's use the following chart to see if for a particular situation the company made a profit or gain.
| Teams | Predicted Hours | Actual Hours |
|---|---|---|
| Collaboration | 21.26 | 18.03 |
| Design | 25.30 | 27.25 |
| Programming | 7.15 | 6.21 |
| Debugging | 7.60 | 8.90 |
| TOTAL | 61.31 | 60.39 |
Our equation would be
y = 95x
y=95(61.31-60.39)=95(6.92)=657.4 So the company made a gain of $657.4 based on the hours table. Can you find out if within each team they made a profit or if one particular team had a profit loss. let's look at the debugging team. Their equation would be y = 95(7.60-8.90)=95(-1.3)=-123.5 So the debugging team cause a loss of $123.50. Notice that we are not putting the absolute value around the profit loss and gain because we want to see exactly how much we lost in dollar amount.
After going through this lesson students should have a good feel for how to develop a linear equation given a similar situation and how to calculate profit loss and gain. Below is a worksheet that would assess their understanding of the material.