Rational functions
by Hwa Young Lee
A rational function has an equation of the form
where p(x) and q(x) are polynomials.
The function is defined when
and hence the domain of f is the set of all points x for which
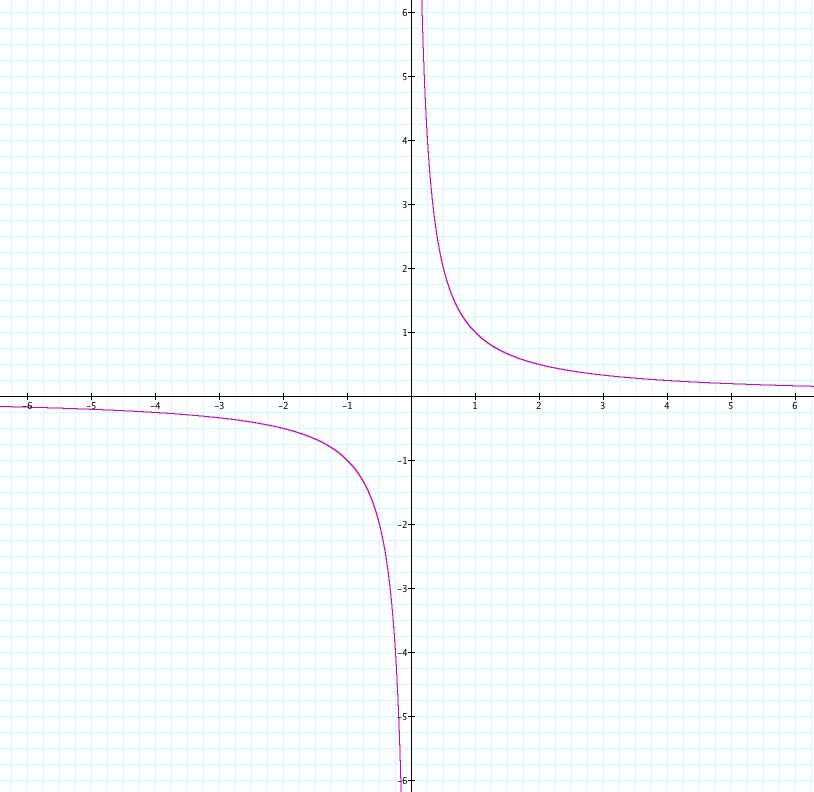
1) We start our exploration with
.
What is the domain and range of the function? What does the graph look like?
It is a rational function and it is easy to see that the graph would look like this:
The domain and range are both
and the graph is a hyperbolic curve symmetric about the origin, positioned in the first and third quadrants.
The asymptotes (which are lines that the graph of the function approaches but never touches) are x=0 (the y-axis) and y=0 (the x-axis).
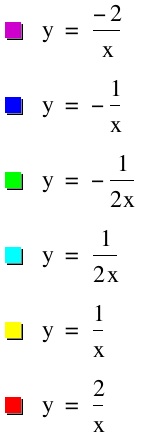
2) What changes are there in
compared to
Well, let’s try a few values for k and see what the graph looks like.
For
, both the domain and range do not change.
The graph is still a hyperbolic curve that is symmetric about the origin and the asymptotes are the same.
Then what does k do?
Well, you can see that the larger |k| is, the farther it is from the origin.
Also, when k>0, the graph is in the first and third quadrant. When k<0, the graph is in the second and fourth quadrant.
For k=0, the equation becomes y=0, which is the x-axis.
However, to be defined, note that x cannot be equal to zero and hence there is a hole in the graph at (0, 0).
3) Now, let’s observe
When
What changes are there due to this?
You may notice that the domain is
and range is
.
The graph is symmetric about (p, q) and the asymptotes are x=p and y=q.
When k=0, the equation becomes y=q, but is not defined at x=p thus, is a horizontal line with a hole at (p, q).
What was the observation above all about?
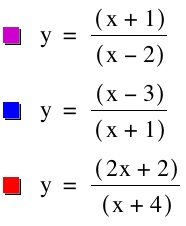
Well, we are going to use these mathematical ideas to observe the rational function
.
What affects to the function do you think the parameters a, b, c, and d have?
Let’s first see a few examples.
Any ideas? To find out, we rewrite the equation in a familiar form.
When c=0, it becomes a linear equation.
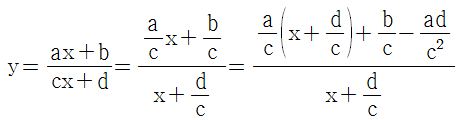
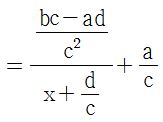
When c is not equal to zero,
So, comparing this equation with the form of
discussed above, you can see that
!
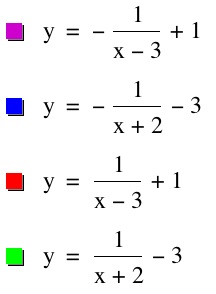
When
, it is easy to see that the graph of
is translated
units horizontally and
units vertically.
You may notice that the domain is
and range is
.
The graph is symmetric about (p, q) and the asymptotes are x=
When ad-bc=0, the equation becomes y=
.
* When graphing, it is also helpful to find the x-intercepts (the x-value when y=0 :
in this case) and y-intercepts (y-value when x=0:
in this case) but in this assignment, we focus on the behavior of the graph in terms of the domain, asymptotes or holes, and range. We are going to use limits to further our investigation to rational functions in general.
Recall that a rational function has an equation of the form
Because the function is not defined when the denominator becomes zero, we exclude the x-values that satisfy q(x)=0 from the domain.
Let’s say
. Then the function is not defined at
.
However, we can find the limit of the function when x approaches
A) Vertical asymptotes and holes x=
Now let’s take a look at three different examples.
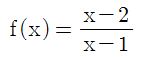
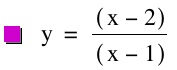
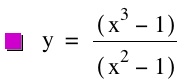
a)
In this case, x=1 is excluded from the domain.
So, x=1 is the vertical asymptote.
Let's check the graph.
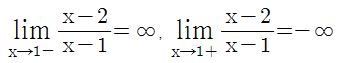
When
, as x approaches
Recall from
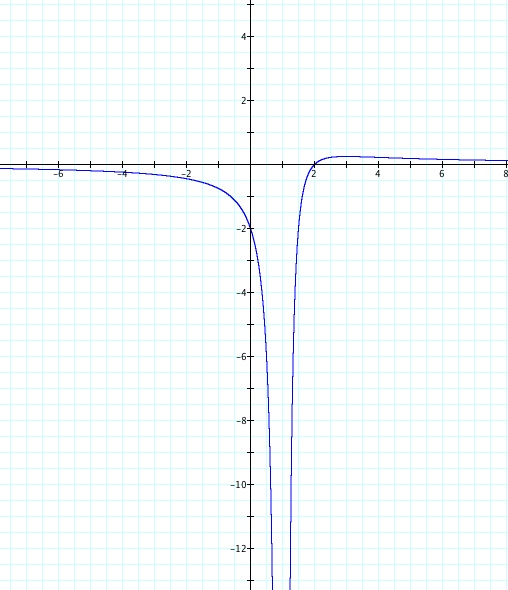
b)
In this case, x=1 is excluded from the domain and after cancellation,
, so x=1 is still the vertical asymptote.
Let's check the graph.
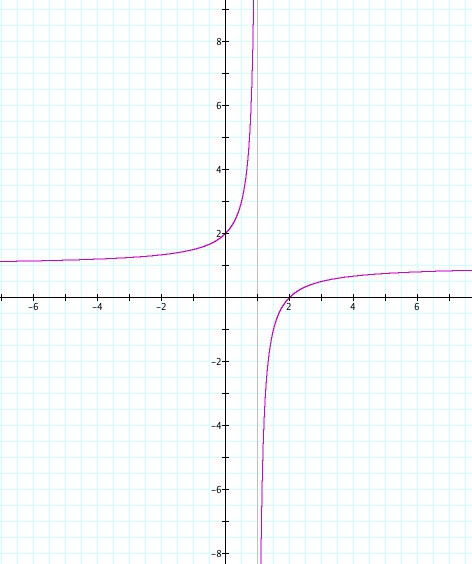
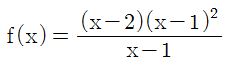
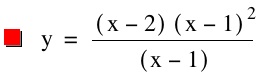
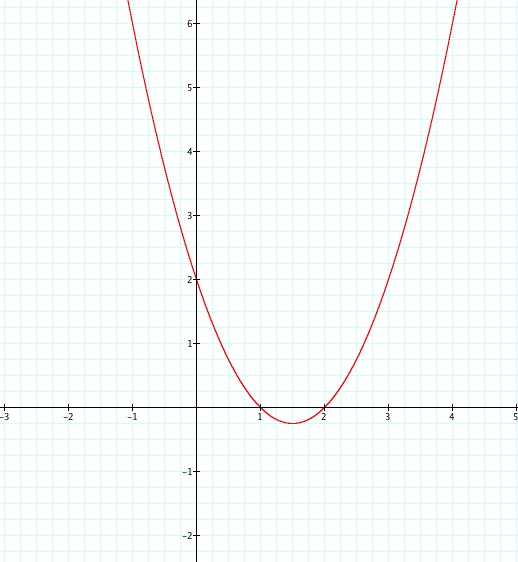
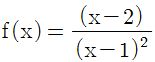
c)
In this case, x=1 is excluded from the domain but after cancellation, f(x)=(x-2)(x-1).
So the function becomes a quadratic, however is not defined at x=1, so there is a hole at x=1.
Let's check the graph.
(Maybe you can't see the hole, but there is one!)
We can sum up from these examples as the following.
When there are more (x-
When there are equal number of (x-
B) Horizontal asymptotes
The horizontal asymptote shows us the (right or left) end behavior of the graph as x approaches infinity or negative infinity.
The line y=m is a horizontal asymptote of the curve y=f(x) if either
or
.
These horizontal asymptotes affect the range of the function.
For
, so we have a horizontal asymptote y=
Let’s use this idea and look at rational functions in general.
Let
When deg(p(x))=deg(q(x)),
, which is the ratio of the leading coefficients.
In this case,
is the horizontal asymptote.
When deg(p(x))<deg(q(x)),
, so the x-axis becomes the horizontal asymptote.
When deg(p(x))<deg(q(x)), the limit of the function when x approaches infinity or negative infinity goes to infinity or negative infinity, with no horizontal asymptote but maybe an oblique asymptote which we explore next.
C) Oblique (slant) asymptotes
For a rational function
After performing long division, you can see that f(x)=(linear)+(remainder) and as x approaches positive or negative infinity, the remainder approaches zero.
Hence the graph of the rational function approaches the linear, resulting in having an oblique asymptote.
Let’s examine these ideas from some examples.
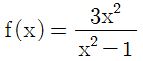
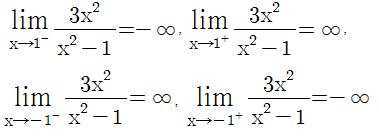
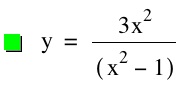
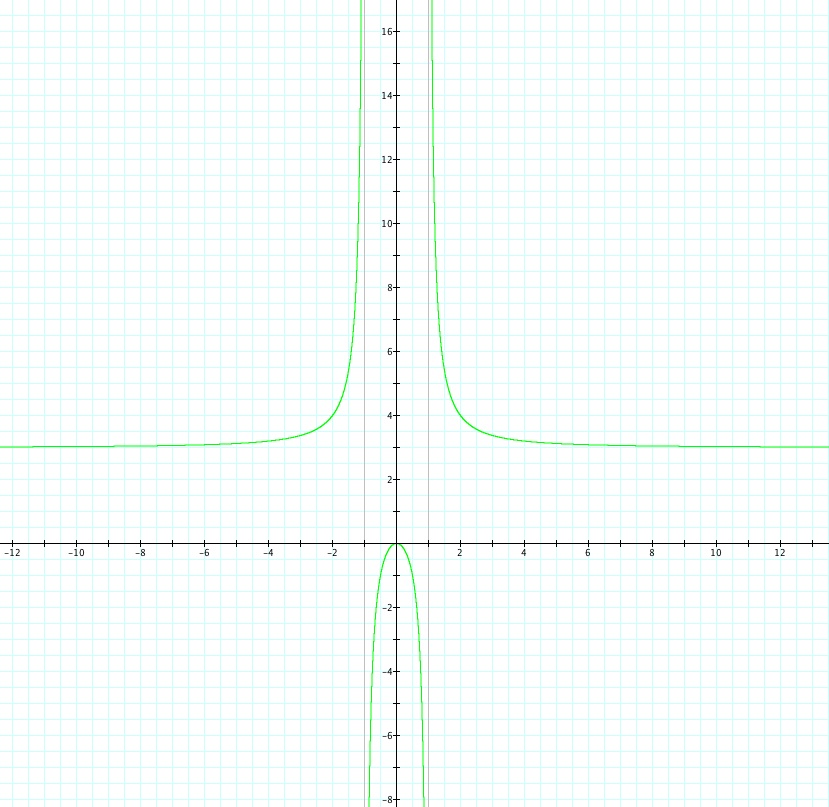
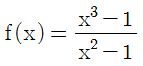
a)
First, the domain is
Second,
so x=1 and x=-1 are vertical asymptotes.
Third,
=3 so y=3 is the horizontal asymptote which gives us the range
.
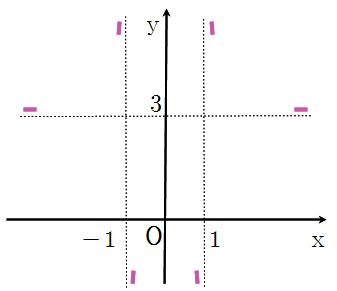
With this information, we can guess the position and end behavior of the graph:
After finding information such as the x- and y-intercepts, the critical points, intervals of increase and decrease, and concavity, we can complete the graph.
Let’s see if our initial guess was correct.
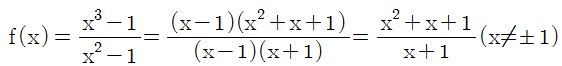
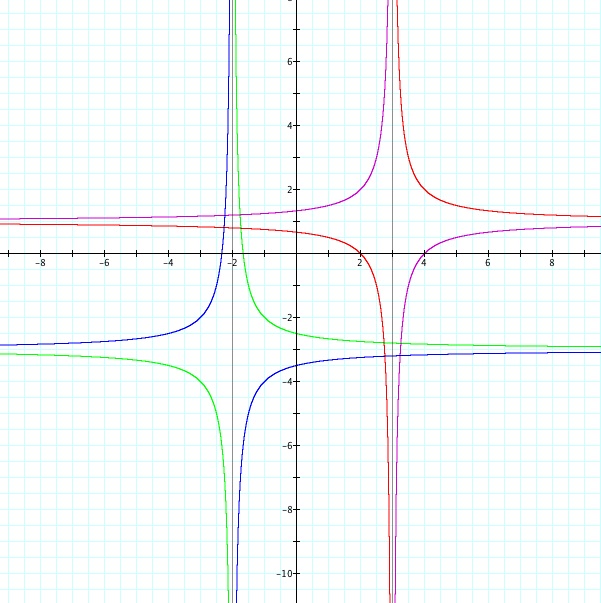
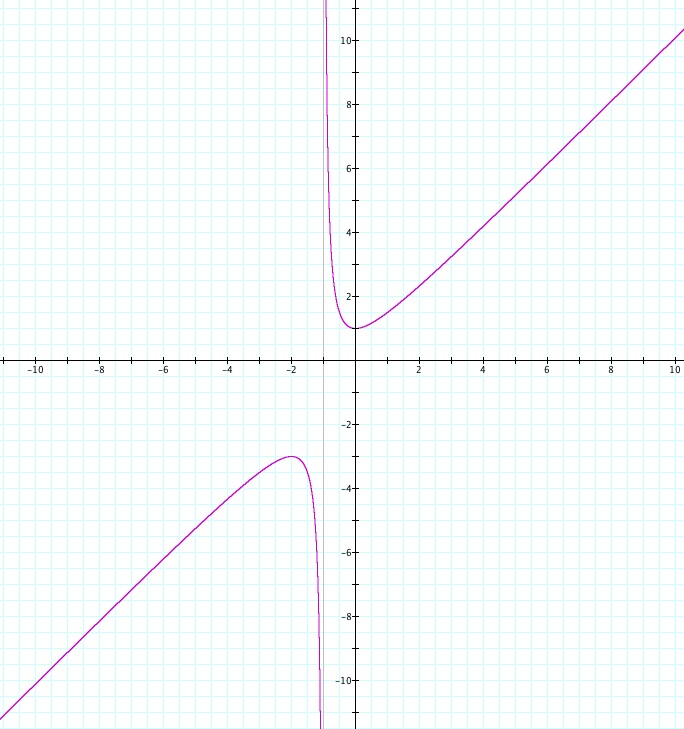
b)
First, the domain is
Second,
There is a hole at
and
so x=-1 is a vertical asymptote.
Third,
and
goes to infinity as x approaches negative or positive infinity.
Hence, y=x is the oblique asymptote.
With this information, we can guess the position and end behavior of the graph:
After finding information such as the x- and y-intercepts, the critical points, intervals of increase and decrease, and concavity, we can complete the graph.
Let’s see if our initial guess was correct.
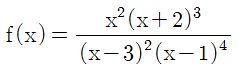
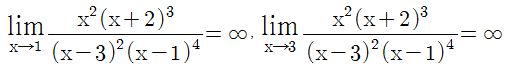
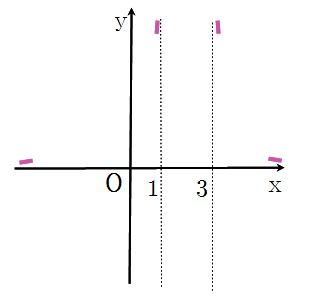
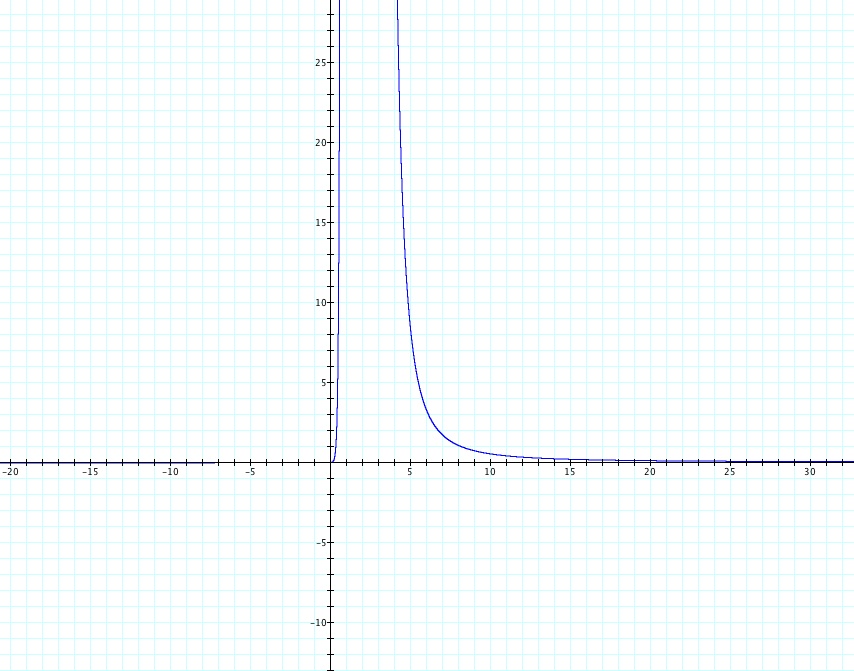
c)
First, the domain is
Second,
so x=1 and x=3 are vertical asymptotes.
Third,
With this information, we can guess the position and end behavior of the graph:
After finding information such as the x- and y-intercepts, the critical points, intervals of increase and decrease, and concavity, we can complete the graph. Let’s see if our initial guess was correct.