
Assignment 11:
Investigating Polar Equations of the Form
r = a + b cos (kθ)
by
Ángel M. Carreras Jusino
Goal:
Investigate how the parameters a, b, and k affects the graphs of the polar equations of the form r = a + b cos (kθ).
Let begin by reviewing what polar coordinates are. If P is a point in the plane, let r be the distance from the origin O to P and let θ be the angle between the positive x-axis and the line OP. Then the point P is represented by the ordered pair (r,θ) and r, θ are called polar coordinates of P (see figure below). We use the convention that an angle is positive if measured in the counterclockwise direction from the positive x-axis and negative in the clockwise direction.

First we are going to explore curves of the form r = cos (kθ) for different values of k.
If k = 0, then we have r = 1, since r represents the distance from the point to the origin, this curve represents the circle with center O and radius 2.
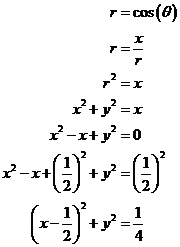
If k = 1, then we have r = cos (θ), one way to understand the graph of this curve is to convert its equation into a Cartesian equation using the facts that x = r cos (θ) and that r2 = x2 + y2.

So we obtain the equation of a circle with center (½, 0) and radius ½.

If k = 2, then we have r = cos (2θ), for this lets look at the graph of r = cos (2θ) in Cartesian coordinates. This will enable us to read at a glance the values of r that correspond to increasing values of θ.

We see that as θ increases from 0 to π/4, r decrease from 1 to 0, this means that the curve begin in the point (1,0) and then go to the origin at the angle π/4 (see figure 1). Then as θ increases from π/4 to π/2, r increase from 0 to 1 in the negative direction, this means that this piece of the curve start at the origin at an angle of π/4 in the third quadrant and goes to the Cartesian coordinate (0, -1) (see figure 2). As θ increases from π/2 to 3π/4, r decrease from 1 to 0 as shown in figure 3. As θ increases from 3π/4 to π, r increase from 0 to 1 as shown in figure 4. As θ increases from π to 5π/4, r decrease from 1 to 0 as shown in figure 5. In a similar fashion, as shown in the figures 6 to 8 the rest of the graph is drawn.
Figure 1 |
Figure 2 |
Figure 3 |
Figure 4 |
Figure 5 |
Figure 6 |
Figure 7 |
Figure 8 |
.jpg)
r = cos (2θ)
The resulting curve has four loops and is called a four-leaved rose. We can see in this case that the number of period of the function when graphed in Cartesian coordinates is going to be the number of leaves in the rose. With the help of an animation we will see that is the same for other cases.
r = cos (kθ)
Now lets explore curves of the form r = b cos (kθ) for different values of b and k. Note that if we look at the function in Cartesian coordinates the value of b is the amplitude of the function, therefore it doesn't affect the period of the function. So, we expect that the effect on the polar curve would be analog to it, i.e., we are going to obtain similar graphs in different proportions. Lets see some examples.
r = b cos (2θ)
|
|
Finally, lets look at the curves defined by the polar equations of the form r = a + b cos (kθ).
If a = 0, then we have the cases explained before.
If a = 1, then we have a lot of possible combinations. Lets try some cases and see what generalizations we can do from there.
Case 1. Lets consider the polar function r = 1 + cos (θ).
We first sketch the graph of r = 1 + cos (θ) in Cartesian coordinates by shifting the cosine curve up one unit. This enables us to read at a glance the values of r that correspond to increasing values of θ.
.jpg)
We see that as θ increases from 0 to π/2, r decrease from 2 to 1, so we have the corresponding part of the polar curve in figure 9. As θ increases from π/2 to π, r decreases from 1 to 0, so we have the next part of the curve as in figure 10. As θ increases from π to 3π/2, r increases from 0 to 1 as shown in figure 11. Finally, as θ increases from 3θ/2 to 2θ, r increases from 1 to 2 as shown in figure 12.
Figure 9 |
Figure 10 |
Figure 11 |
Figure 12 |
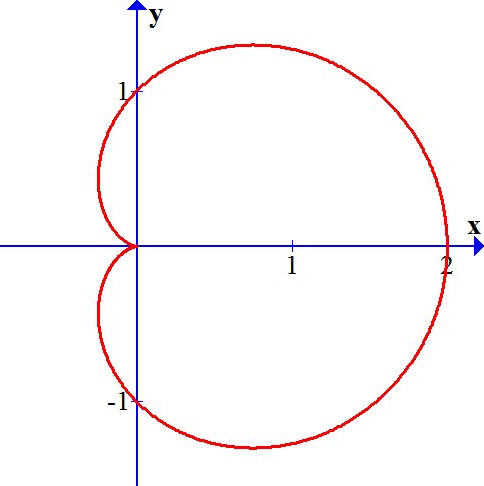
Putting together the parts of the curve from figure 9 - 12, we sketch the complete curve in the figure below. It is called a cardioid because it's shaped like a heart.

r = 1 + cos(θ)
One interesting thing to investigate is what happens to the graph of r = a + cos (θ) for 0 < a < 1. In terms of this curve in Cartesian coordinates this means that part of the curve is going to be above the x-axis and the other part below. This will produce negative values of r, resulting in loops in the graph. Lets take a look at this in the following animation.
Apparently, we have loops only when the part of the range of the function r = a + cos (θ) is negative, i.e., when the radius is negative for some values of the domain. Lets see other animations were this is shown.
r = a + cos (2θ)
|
r = a + cos (3θ)
|
r = a + cos (4θ)
|
Is expected that if the values of the range of the function r = a + cos (θ) are all negative, in Cartesian coordinates, then will be no loops in its Polar representation.