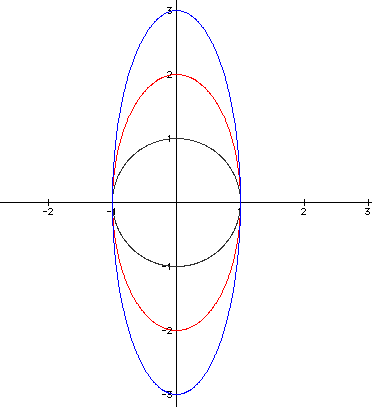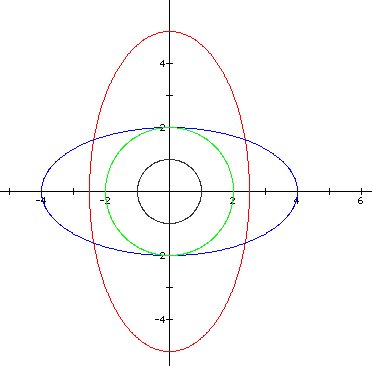


Below, we investigate the effect that the value of a has on the graph. We will keep b constant in each case with b = 1. The values of a for each graph are

Notice that when a = 1 and b = 1, the graph is a circle with radius = 1. When a is changed, the circle seems to be pulled "side to side." The graph appears to be an ellipse that intersects the x-axis at -a and a; and intersects the y-axis at -1 and 1. Therefore, a determines where the graph intersects the x-axis.
Below, we investigate the effect that the value of b has on the graph. We will keep a constant in each case with a = 1. The values of b for each graph are

Notice that when a = 1 and b = 1, the graph is a circle with radius = 1. When b is changed, the circle seems to be pulled "up and down." The graph appears to be an ellipse that intersects the x-axis at -1 and 1; and intersects the y-axis at -b and b. Therefore, b determines where the graph intersects the y-axis.
Below are variations of the graph:
|
|
|
|
|
|
|
|
|
|
|
|
|
|
|

Note that negative values of a and b have the same effect as the positive values. Also, notice that if a = b, then the graph is always a circle. Otherwise, the graph is an ellipse.