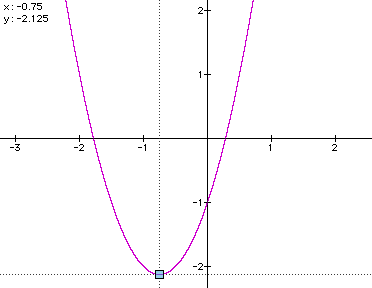
The graph for the function y = 2x^2 + 3x - 1 is hardly mysterious: The parabola opens up (since the coefficient of a^2 is positive) and has vertex at (-3/4, -17/8), as you can see below.
What happens to the graph if we add in an xy term? That is, what changes if we graph y = 2x^2 + xy + 3x - 1 ?
|
the purple graph is y = 2x^2 + 3x - 1; 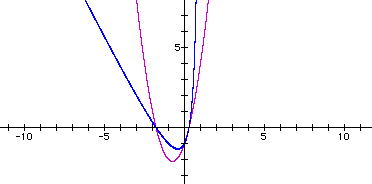 |
At first glance the graph might appear to be a rotated parabola (which is not an outlandish guess, since the presence of an xy term in a conic can indicate a rotation of the conic section.) |
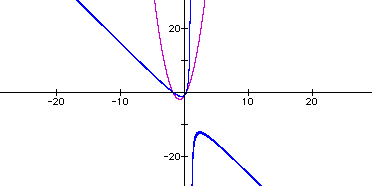 |
But expanding the scales on the axes reveals that in fact, the relation describes a hyperbola. |
So, as the coefficient of the xy term varies, will the relation always describe a hyperbola (except when the xy term vanishes and the graph becomes a parabola)? In other words, for y = 2x^2 + nxy + 3x - 1, what types of relation(s) is/are described as n varies?
Well, one of the best ways to get a feel for this question is to view a movie. When you finish viewing the movie, press the Back button to return to this page.
In the movie, as n varies from -10 to 10, the graph appears to move from a hyperbola to a parabola (at n = 0) and back to a hyperbola. Notice that for n close to 0, further investigation is necessary to determine whether h is a parabola or a hyperbola, since for small values of n the movie's window reveals u-shaped graphs that could be parabolas or parts of hyperbolas.
Let's see what happens when n = -0.2, -0.1, 0.1, and 0.2. We want to determine visually whether we have hyperbolas or parabolas for these values of n. In the image below, the purple graph is y = 2x^2 + 0xy + 3x - 1 (that is, n = 0.) Then n = -0.2 (light blue graph), -0.1 (green graph), 0.1 (red graph), and 0.2 (dark blue graph).
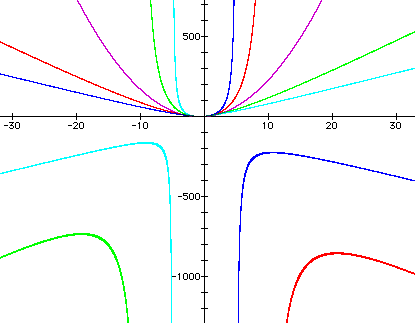
While the scale has to be considerably expanded to view the "second parts" of the hyperbolas (especially for the red and green hyperbolas, i.e. for n very close to 0), this graph provides evidence for the conjecture that y = 2x^2 + nxy + 3x - 1 is a parabola only when n = 0, and is otherwise a hyperbola.
Also notice that for n < 0, the rotation of the hyperbolas appears to proceed to the right, or clockwise (see the light blue and green graphs above.) For n > 0, the rotation of the hyperbolas appears to proceed to the left, or counterclockwise, as shown by the red and dark blue graphs above. (This observation can also be confirmed by viewing the movie, which, if you like, you can see again by scrolling up.)
In the movie, an interesting switch seems to occur at n = approximately 3.5. The hyperbola passes from vertices with "branches" opening in the second and fourth quadrants to vertices with branches that open mostly in the first and third quadrants.
Therefore, let's zoom in: view the short zoom movie, and when you finish viewing the movie, press the Back button to return to this page.
I conjecture that there is a value of n between 3.48 and 3.62 that makes the hyperbola become degenerate (i.e., two intersecting lines.) Before this moment of becoming degenerate, the hyperbola opens in one orientation or direction, and after it opens with a different orientation or direction.
Well, first an example, then a proof which relies on technology.
(1) To verify that the equation produces a hyperbola for a specific non-zero value of n, view this example.
(2) To prove that the equation produces a hyperbola when n is not 0, view this proof.
Return to the Write-Ups on Amy's Class Page