
| This is the write-up of Assignment #10 |
Brian R. Lawler
|
| EMAT 6680 |
11/28/00
|
The Problem
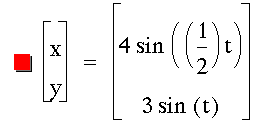
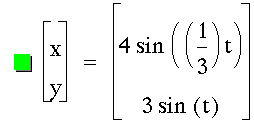
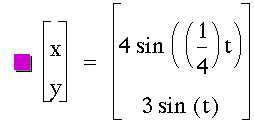
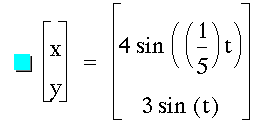
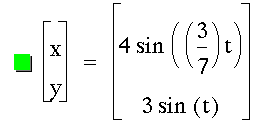
Consider the parametric equations
 |
Graph these for
Describe observations fully.
Analysis
I began by doing exactly as instructed. Graphing those parametric equations in Graphing Calculator 3.0 yielded a line from (-4, -3) to (4, 3) when a = b = 1. I was a bit surprised - and also curious to see after what values for t did the graph redraw itself. It appears that at approximately 1.5pi the complete line appears. See my initial sketch below. Click on the image itself to download the graph to investigate on your own (this will work anywhere on this webpage).
Next, I set off to investigate various fractions a / b. Initially, I began changing the b values.
 |
 |
 |
 |
 |
 |
 |
 |
It appears that these shapes continue to be bounded by the rectangle from (-4, -3) to (4, 3). In fact, this must be since the sine function has a minimum value of -1 and a maximum of 1. Thus, the coefficients 4 and 3 create this horizontal and vertical stretch.
I also noticed that the denominator also seemed to be related to the number of "hills" or local maximums of the parametric functions. For example, when b = 4 there are 4 hills. But while this simple description held up well for the even values of b, the odd denominators weren't so nice. Until I also recognized that this value of b related to the number of x-intercepts. Namely, for even b's, there are b + 1 x-intercepts, and for odd B's, there are exactly b x-intercepts. This observation led me to conjecture that when I begin adjusting the numerator, the value for a will influence the number of y-intercepts.
Before jumping into adjusting the numerator, I looked at other values for the denominator, including decimal values. You may view a Quicktime movie of some of these changes in the denominator. To manipulate the values yourself, download a version of the graph that easily allows for adjustment of the denominator.
A final note: the limiting of t to positive values up to 50 begins to limit the "amount" of the graph that will be completed. For every values of the denominator, eventually the graph will cycle. But this value is directly related to this fractional coefficient of t. As that fraction gets very small, a larger maximum t is necessary to view the entire cycle.
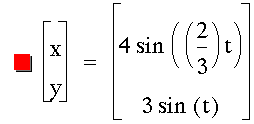
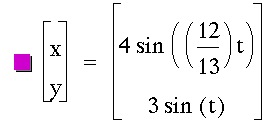
While investigating the numerator, I quickly was reminded that some fractions can be simplified. Of most significance to me at this point were the fractions that had both even a and b values. This was important to me because I was identifying the number of y-intercepts based around even and odd values for a just as I had for b values earlier. My conjecture from above seemed to hold up - provided the fraction was reduced. Observe a few examples below.
 |
 |
 |
 |
 |
 |
Some final observations are that if both numerator and denominator are odd and coprime, the shape seems to be unfinished, as in 1/3, 1/5, and 3/7. If an even number is in either place, the shape seems to finish. If the even number is in the denominator, this closing seems to occur on the x-axis. And vice-versa for closing on the y-axis. In a related manner, the closed images all have a symmetry about the x-axis. And further, the unfinished images have a rotational symmetry, 180 degrees about the origin. To manipulate the values yourself, download a version of the graph that easily allows for adjustment of the numerator.
Conclusions
In this investigation, I studied the effects of both the numerator and denominator of the coefficient on the t variable in the x parameter. Generally, all graphs of this particular family of parametric equations have an attractive cyclical nature in both the x and y directions. Some of the shapes take on a ring-like quality, almost tricking the eye into seeing a 3 dimensional view of a wedding ring. When the values of both a and b begin getting large, the shape looks very rectangular with a prominent crisscrossing pattern, yet still made of curves. And of all shapes, the most interesting seem to be formed when both numerator and denominator are odd.
To summarize a few particulars, the numerator is directly related to the number of y-intercepts and the denominator is directly related to the number of x-intercepts. Namely, for even B's, there are b + 1 x-intercepts, and for odd B's, there are exactly b x-intercepts. And for even a's, there are a + 1 y-intercepts, and for odd A's, there are exactly a y-intercepts. (Both these statements assume the fraction has been reduced.) Additionally, the graphs are fully contained within the rectangle from (-4, -3) to (4,3).
Reflections
This was an interesting, playful investigation. The full set of problems in this Assignment#10 gave me some good insights into seeing parametric equations working. As always, the power of the graphing calculator allowed for incredible flexibility in testing out conjectures. Rather than having to recompute and redraw by hand - or strictly imagine in my mind - I was able to see what happens when changing parameters of the function or even the range of the control variable t.
I created an incredible amount of work and documents while working on posting this page. I also sound myself playing and learning quite a bit - not only on how to create an effective presentation, but also do some things with a great variety of technological tools.
The mathematics of this particular investigation leads me to be curious to refresh my memory on translating back and forth between x-y functions (or relations) and parametric equations. I would like to see how these parameter changes effect the other forms of these graphs. As I think about that, it might be that this parametric form is the much more simpler way of viewing these relationships. So then, I would be curious to develop notions such as amplitude, period, and phase shifts as the coefficients and constants of both the x and y parameters are adjusted.
Be sure to send me an e-mail if I made any errors, if you have any questions, or any other thoughts.
 |
Comments? Questions? e-mail me at blawler@coe.uga.edu |
| Last revised: December 28, 2000 |
|