,  Some Different Ways
to Explore

By: Dr. James W. Wilson
and
Elizabeth Gore
It has now become a
rather standard excercise, with available technology, to consturct
graphs to consider the equation
 and to overlay several
graphs of
 for different values
of a, b, or c as the other two are held constant.
From these graphs,
discussion of the patterns for the roots of
 can be followed.
For example, if we
set
 for b = -3, -2, -1,
0, 2, 3, and overlay the graphs, the following picture is obtained.

 We can discuss the
"movement " of a parabola as b changes.
Notice that the parabola
always passes through the same oint on the y-axis (the point (0,1)
using the above equation).
For b < -2, the
parabola will intersect the x-axis in two points with negative
x values (i.e. the original equation has two positive real roots).
For b = -2, the parabola
is tangents to the positive x-axis, and so the original equation
has one positive real root. (at the opint of tangency).
For -2 < b <
2, the parabola does not intersect the x-axis; Therefore, the
original equation has no real roots. (i.e. the roots are imaginary).
Similarly, for b =
2, the parabola is tangent to the negative x-axis (so the original
equation has one negative real root).
And for b > 2, the
parabola intersects the x-axis twice ( so the original equation
has 2 negative real roots).
Now consider the locus
of the vertices of the set of parabolas graphed from
 We can show that the
locus of the vertices is the parabola which has the equation
 How do we do that?
We must use the vertex
of the parabola and a point on the parabola.
We know that since
the a value of the parabola is negative that the parabola opens
downward.
Since our parabola
must sit at the vertex of (0,1), we will look at the equation
 Lets take the point
on the parabola (-1,0) and find out whether a=-1.
We substitute in -1
for x and 0 for y and get the following equation.
 Solving for a, we see
that indeed
 So we can say with
confidence that the locus os the vertices is the parabola which
has the equaiton
 The figure shown below
shows the original graph, plus the graph of the locus of the vertices.
What can you generalize?

 Generalization:
The locus of the vertices
contains the point (1,0) and has a vertexz of (0,1). This gives
us a new parabola with the equation
 If we substitute our
point (1,0) into the equation, we will get
 yeilding
 so
so
 so we get the equation
of the parabola to be
 or simply
 In general, we get
( 0, c ) as the vertex of our parabola.
Graphs In the xa Plane
There are other ways
to examine the roots of a quadratic equation by examining the
graph.
One way is to graph
in the xa plane instead of the xy plane.
This simply means that
we will substitute y for a in the a quadratic equation.
Let us consider the
equation
 We can graph this relation
in the xa plane by graphing the equaiton
 Here is what we get:
 If we take any particular
value of a, and overlay the equation y = a on the graph, we add
a line parrallel to the x-axis.
If the line intersects
the curve in the curve in the xa plane, the intersection point
correspoonds to the roots of the original equation for the value
of a.

 We can see on this
single coordinate plane, that we get no real roots of the original
equation when a > 0.25.
When a = 0.25, we get
one negative real root.
When a < 0.25 we
get two real roots.
Graphs in the xb Plane
Now, instead of graphing
in the xy plane, we will graph in the xb plane.
This simply means we
will substitute y for b in to a quadratic equation and then graph
it.
Consider again the
equation
 .
Now we will graph this
relation into the xb plane. To do this, we will need to graph
the equation
 This is the graph we
get.
 If we take a particular
value of b and overlay the equation y = b on the graph,
we add a parallel line
to the x-axis.
If the line intersects
the curve in the xb plane,
the intersection points
correspond to the roots of the original equation for the value
of b.
Take this graph into
consideration.

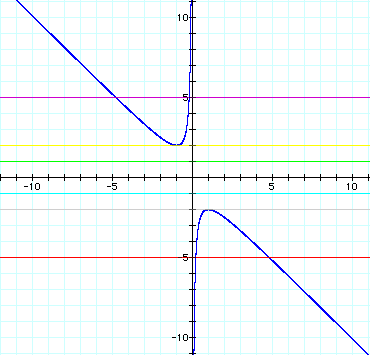 It is pretty clear
that on this plane we get:
When b > 2, we get
two real roots.
When b = 2, we get
one real root.
When -2 < b <
2, there exist no real roots.
When b < -2, we
get two real roots.
What if c = -1 rather
than 1? Our equation would look like


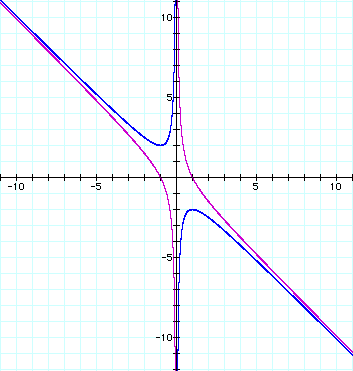 What can you conclude
about the roots of the new equation for different values of b
by examining the above graph?
Graphs in the xc Plane
Finally, instead of
graphing in the xy plane, we will graph in the xc plane.
Once again, this just
means that we will substitute y for c in the quadratic equation.
Lets look at the equation
 To graph this into
the xc plane we need to graph
 This is what we get
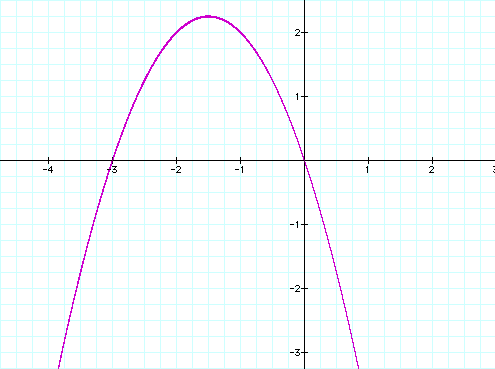 When the equaiton is
graphed into the xc plane, it is easy to see that the curve will
be a parabola.
If we take any particular
value of c, and overlay the equation y = c, we add a line parrallel
to the x-axis.
The intersections of
these lines with the parabola yeilds the roots of the original
equation for c.
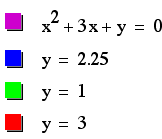
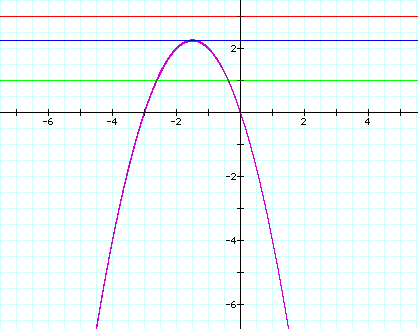 It does not take a
rocket scientist to see that..
When c > 2.25, you
have no real roots
When c = 2.25, there
exists one real root.
When c < 2.25 you
get two real roots.
Once you get over the
hill of actually understanding about changing coordinate planes,
you have found a quick way to find roots of a quadratic equation.
If you have had enough,
you can click HERE to get back to my HomePage.


