
Assignment # 12
Fall 2002 Semester
Spreadsheets - The Spreadsheet in Math Exploration
The Spreadsheet in Mathematics Explorations
Two different applications of the spreadsheet are shown in this example.
In the “Maximization of a Lidless Box”, the spreadsheet tool is used to iterate the problem to determine a solution.
In the “Cooling of Boiling Water” the different tools within the spreadsheet tools are used to determine an equation that approximates measured data.
Both tools are useful from the classroom perspective as methods to understand the mathematics behind the problem.
Some additional spreadsheet examples are provided at the end. See Other Examples...
This example shows the effectiveness of the spreadsheet in the determination of a solution for a problem concerning maximization or minimization. The problem noted is one where the maximum volume of a lidless box is desired. A square, with square corners removed is given with an overall outside dimension of 5 X 8. How large should the square corners be? It is easily seen that the corners determine the height of the box desired. The height will impact the length and width (and subsequent volume)
The corners are cutout and folded along the lines shown.
The spreadsheet allows us to make multiple calculations of the volume of the open box, by changing the dimensions on the cutout squares in the corners.
Using S to represent the side dimension of the cutout squares, the relationship of S to the length, width and height of the box is as follows:
(Height) H = S
(Width) W = 5 – (2*S) ; The width is reduced by the twice the cutout side dimension.
(Length) L = 8 – (2*S) ; The length is also reduced by twice the cutout side dimension.
Volume = Height * Width * Lengt
V = S * (5 – (2*S)) * (8-(2*S))
V = S (5-2S)(8-2S)
V = 4S3 - 26S2 + 40S
Using the spreadsheet, we can setup a table where we start with values for S and progressively determine the height, length and width.
The
table below shows the first pass, at determining the answer to the maximization
problem:
|
Problems of Maximization |
|||
|
Lidless
box formed by 5 X 8 sheet with a square removed from each corner…. |
|||
|
x |
|
||
|
Height |
Length |
Width |
Volume |
|
0.10 |
7.80 |
4.80 |
3.74 |
|
0.20 |
7.60 |
4.60 |
6.99 |
|
0.30 |
7.40 |
4.40 |
9.77 |
|
0.40 |
7.20 |
4.20 |
12.10 |
|
0.50 |
7.00 |
4.00 |
14.00 |
|
0.60 |
6.80 |
3.80 |
15.50 |
|
0.70 |
6.60 |
3.60 |
16.63 |
|
0.80 |
6.40 |
3.40 |
17.41 |
|
0.90 |
6.20 |
3.20 |
17.86 |
|
1.00 |
6.00 |
3.00 |
18.00 |
|
1.10 |
5.80 |
2.80 |
17.86 |
|
1.20 |
5.60 |
2.60 |
17.47 |
|
1.30 |
5.40 |
2.40 |
16.85 |
|
1.40 |
5.20 |
2.20 |
16.02 |
|
1.50 |
5.00 |
2.00 |
15.00 |
|
1.60 |
4.80 |
1.80 |
13.82 |
|
1.70 |
4.60 |
1.60 |
12.51 |
|
1.80 |
4.40 |
1.40 |
11.09 |
|
1.90 |
4.20 |
1.20 |
9.58 |
|
2.00 |
4.00 |
1.00 |
8.00 |
|
2.10 |
3.80 |
0.80 |
6.38 |
|
2.20 |
3.60 |
0.60 |
4.75 |
|
2.30 |
3.40 |
0.40 |
3.13 |
|
2.40 |
3.20 |
0.20 |
1.54 |
|
2.50 |
3.00 |
0.00 |
0.00 |
The
highlighted area indicates an appropriate area to look further into the
solution. The next two tables
further expands the area of interest.
|
Height |
Length |
Width |
Volume |
|
Height |
Length |
Width |
Volume |
|
0.90 |
6.20 |
3.20 |
|
|
0.990 |
6.020 |
3.020 |
17.9986 |
|
0.91 |
6.18 |
3.18 |
17.884 |
|
0.991 |
6.018 |
3.018 |
17.9989 |
|
0.92 |
6.16 |
3.16 |
17.908 |
|
0.992 |
6.016 |
3.016 |
17.9991 |
|
0.93 |
6.14 |
3.14 |
17.930 |
|
0.993 |
6.014 |
3.014 |
17.9993 |
|
0.94 |
6.12 |
3.12 |
17.949 |
|
0.994 |
6.012 |
3.012 |
17.9995 |
|
0.95 |
6.10 |
3.10 |
17.965 |
|
0.995 |
6.010 |
3.010 |
17.9996 |
|
0.96 |
6.08 |
3.08 |
17.977 |
|
0.996 |
6.008 |
3.008 |
17.9998 |
|
0.97 |
6.06 |
3.06 |
17.987 |
|
0.997 |
6.006 |
3.006 |
17.9999 |
|
0.98 |
6.04 |
3.04 |
17.994 |
|
0.998 |
6.004 |
3.004 |
17.9999 |
|
0.99 |
6.02 |
3.02 |
17.999 |
|
0.999 |
6.002 |
3.002 |
18.0000 |
|
1.00 |
6.00 |
3.00 |
18.000 |
|
1.000 |
6.000 |
3.000 |
18.0000 |
|
1.01 |
5.98 |
2.98 |
|
|
1.001 |
5.998 |
2.998 |
18.0000 |
|
1.02 |
5.96 |
2.96 |
17.994 |
|
1.002 |
5.996 |
2.996 |
17.9999 |
|
1.03 |
5.94 |
2.94 |
17.988 |
|
1.003 |
5.994 |
2.994 |
17.9999 |
|
1.04 |
5.92 |
2.92 |
17.978 |
|
1.004 |
5.992 |
2.992 |
17.9998 |
|
1.05 |
5.90 |
2.90 |
17.966 |
|
1.005 |
5.990 |
2.990 |
17.9997 |
|
1.06 |
5.88 |
2.88 |
17.950 |
|
1.006 |
5.988 |
2.988 |
17.9995 |
|
1.07 |
5.86 |
2.86 |
17.933 |
|
1.007 |
5.986 |
2.986 |
17.9993 |
|
1.08 |
5.84 |
2.84 |
17.912 |
|
1.008 |
5.984 |
2.984 |
17.9991 |
|
1.09 |
5.82 |
2.82 |
17.890 |
|
1.009 |
5.982 |
2.982 |
17.9989 |
|
1.10 |
5.80 |
2.80 |
17.864 |
|
1.010 |
5.980 |
2.980 |
17.9986 |
The
solution appears center around 1.000 for the maximum volume of the box.
The solution can also be shown by performing the integration of the
volume equation given the starting values. This
in turn links the observed multiple calculations with the calculated values.
A copy of the spreadsheet used for this example is provided at the following link. (Note: EXCEL Spreadsheet - Office 2000 Version)
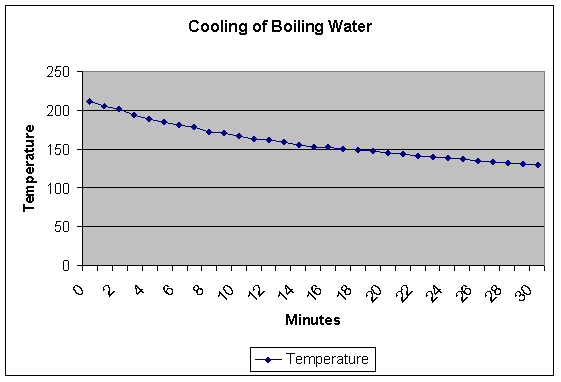
The
table of the measured temperature readings is provided below:
|
Minute |
Temperature |
|
0 |
212 |
|
1 |
205 |
|
2 |
201 |
|
3 |
193 |
|
4 |
189 |
|
5 |
184 |
|
6 |
181 |
|
7 |
178 |
|
8 |
172 |
|
9 |
170 |
|
10 |
167 |
|
11 |
163 |
|
12 |
161 |
|
13 |
159 |
|
14 |
155 |
|
15 |
153 |
|
16 |
152 |
|
17 |
150 |
|
18 |
149 |
|
19 |
147 |
|
20 |
145 |
|
21 |
143 |
|
22 |
141 |
|
23 |
140 |
|
24 |
139 |
|
25 |
137 |
|
26 |
135 |
|
27 |
133 |
|
28 |
132 |
|
29 |
131 |
|
30 |
130 |
The
graph of this table is provided below:
The
graph shows an almost linear function. The
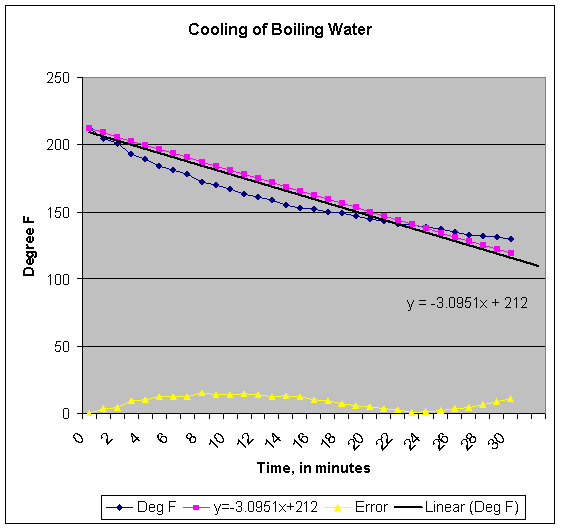
spreadsheet function provides us with tools that will give us an approximate
equation for the line. Using
this tool, and forcing the y-intercept to be at 212 degrees F, yielded the
following equation:
y
= -3.0951x + 212
|
Minutes |
Deg
F |
y=-3.0951x+212 |
Error |
|
0 |
212 |
212
|
0
|
|
1 |
205 |
209
|
4
|
|
2 |
201 |
206
|
5
|
|
3 |
193 |
203
|
10
|
|
4 |
189 |
200
|
11
|
|
5 |
184 |
197
|
13
|
|
6 |
181 |
193
|
12
|
|
7 |
178 |
190
|
12
|
|
8 |
172 |
187
|
15
|
|
9 |
170 |
184
|
14
|
|
10 |
167 |
181
|
14
|
|
11 |
163 |
178
|
15
|
|
12 |
161 |
175
|
14
|
|
13 |
159 |
172
|
13
|
|
14 |
155 |
169
|
14
|
|
15 |
153 |
166
|
13
|
|
16 |
152 |
162
|
10
|
|
17 |
150 |
159
|
9
|
|
18 |
149 |
156
|
7
|
|
19 |
147 |
153
|
6
|
|
20 |
145 |
150
|
5
|
|
21 |
143 |
147
|
4
|
|
22 |
141 |
144
|
3
|
|
23 |
140 |
141
|
1
|
|
24 |
139 |
138
|
1
|
|
25 |
137 |
135
|
2
|
|
26 |
135 |
132
|
3
|
|
27 |
133 |
128
|
5
|
|
28 |
132 |
125
|
7
|
|
29 |
131 |
122
|
9
|
|
30 |
130 |
119
|
11
|
Substituting
in the linear expression into the spreadsheet yields the table shown above.
The plot of this is shown below.
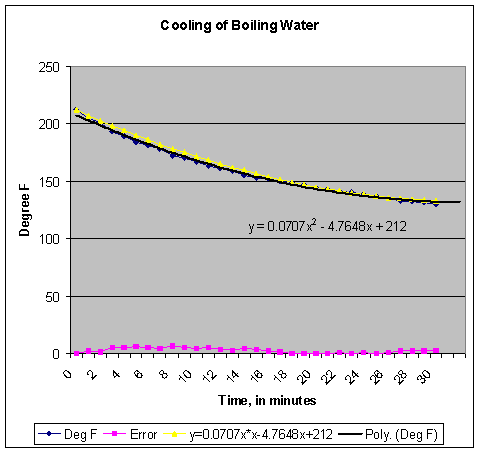
Can we do better at determining a calculation that will represent the
observed data?
The
tool allows us to try other types of equations to represent our data.
A better approximation can be derived from choosing the polynomial
solution method from the plotting function.
As can be seen the 2nd degree polynomial chosen yield the
following:
y
= 0.0707x – 4.7648x + 212
|
Minutes |
Deg
F |
y=0.0707x*x-4.7648x+212 |
Error |
|
0 |
212 |
212
|
0
|
|
1 |
205 |
207
|
2
|
|
2 |
201 |
203
|
2
|
|
3 |
193 |
198
|
5
|
|
4 |
189 |
194
|
5
|
|
5 |
184 |
190
|
6
|
|
6 |
181 |
186
|
5
|
|
7 |
178 |
182
|
4
|
|
8 |
172 |
178
|
6
|
|
9 |
170 |
175
|
5
|
|
10 |
167 |
171
|
4
|
|
11 |
163 |
168
|
5
|
|
12 |
161 |
165
|
4
|
|
13 |
159 |
162
|
3
|
|
14 |
155 |
159
|
4
|
|
15 |
153 |
156
|
3
|
|
16 |
152 |
154
|
2
|
|
17 |
150 |
151
|
1
|
|
18 |
149 |
149
|
0
|
|
19 |
147 |
147
|
0
|
|
20 |
145 |
145
|
0
|
|
21 |
143 |
143
|
0
|
|
22 |
141 |
141
|
0
|
|
23 |
140 |
140
|
0
|
|
24 |
139 |
138
|
1
|
|
25 |
137 |
137
|
0
|
|
26 |
135 |
136
|
1
|
|
27 |
133 |
135
|
2
|
|
28 |
132 |
134
|
2
|
|
29 |
131 |
133
|
2
|
|
30 |
130 |
133
|
3
|
The
graph of the plot follows. This is a
much better approximation of the observed data.
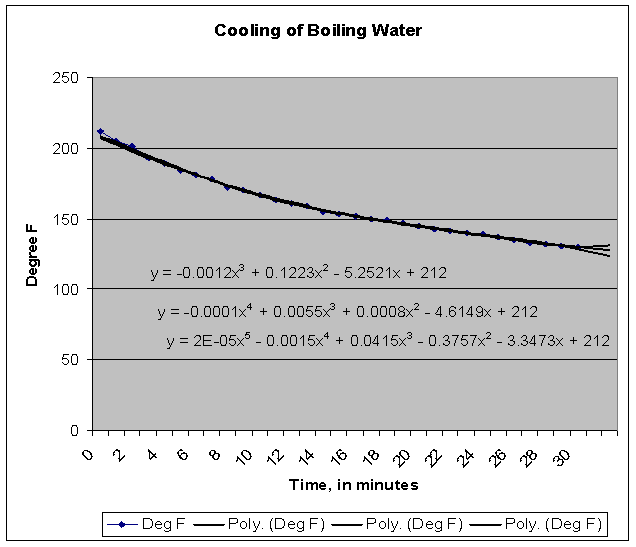
By
further expanding the polynomial(3rd, 4th and 5th
degree), it can be seen that we do not seem to get much closer to the
measurement data. Some examples with
the data are shown below:
3rd
Degree Polynomial Solution:
y
= -0.0012x3 + 0.1223x2 - 5.2521x + 212
4th
Degree Polynomial Solution:
y
= -0.0001x4 + 0.0055x3 + 0.0008x2 – 4.6149x +
212
5th
Degree Polynomial Solution:
y
= 2E-05x5 – 0.0015x4 + 0.0415x3 – 0.3757x2
– 3.3473x + 212
|
Minutes |
Deg
F |
3rd
Degree Polynomial |
Error |
4th
Degree Polynomial |
Error |
5th
Degree Polynomial |
Error |
|
0 |
212 |
212
|
0
|
212
|
0
|
212
|
0
|
|
1 |
205 |
207
|
2
|
207
|
2
|
208
|
3
|
|
2 |
201 |
202
|
1
|
203
|
2
|
204
|
3
|
|
3 |
193 |
197
|
4
|
198
|
5
|
200
|
7
|
|
4 |
189 |
193
|
4
|
194
|
5
|
195
|
6
|
|
5 |
184 |
189
|
5
|
190
|
6
|
190
|
6
|
|
6 |
181 |
185
|
4
|
185
|
4
|
186
|
5
|
|
7 |
178 |
181
|
3
|
181
|
3
|
181
|
3
|
|
8 |
172 |
177
|
5
|
178
|
6
|
177
|
5
|
|
9 |
170 |
174
|
4
|
174
|
4
|
173
|
3
|
|
10 |
167 |
171
|
4
|
170
|
3
|
169
|
2
|
|
11 |
163 |
167
|
4
|
167
|
4
|
166
|
3
|
|
12 |
161 |
165
|
4
|
164
|
3
|
163
|
2
|
|
13 |
159 |
162
|
3
|
161
|
2
|
161
|
2
|
|
14 |
155 |
159
|
4
|
159
|
4
|
159
|
4
|
|
15 |
153 |
157
|
4
|
156
|
3
|
157
|
4
|
|
16 |
152 |
154
|
2
|
154
|
2
|
155
|
3
|
|
17 |
150 |
152
|
2
|
152
|
2
|
154
|
4
|
|
18 |
149 |
150
|
1
|
151
|
2
|
152
|
3
|
|
19 |
147 |
148
|
1
|
149
|
2
|
151
|
4
|
|
20 |
145 |
146
|
1
|
148
|
3
|
151
|
6
|
|
21 |
143 |
145
|
2
|
147
|
4
|
150
|
7
|
|
22 |
141 |
143
|
2
|
146
|
5
|
150
|
9
|
|
23 |
140 |
141
|
1
|
145
|
5
|
150
|
10
|
|
24 |
139 |
140
|
1
|
145
|
6
|
151
|
12
|
|
25 |
137 |
138
|
1
|
144
|
7
|
151
|
14
|
|
26 |
135 |
137
|
2
|
144
|
9
|
153
|
18
|
|
27 |
133 |
136
|
3
|
143
|
10
|
154
|
21
|
|
28 |
132 |
134
|
2
|
143
|
11
|
157
|
25
|
|
29 |
131 |
133
|
2
|
142
|
11
|
160
|
29
|
|
30 |
130 |
132
|
2
|
142
|
12
|
165
|
35
|
The
graphs of the 3rd, 4th and 5th degree
polynomials shows the “spreading” of the lines representing the equations as
we approach the end point of 30 minutes.
Investigations of power,
exponential and logarithmic functions do not give us any better results than the
2nd degree polynomial fit. The
best fit equation for each is as follows:
Power Function:
y = 237.82x-0.1624
Logarithmic Function:
y = -27.097Ln(x) + 227.84
Exponential Function:
y = 212e-0.0177x
We
can also split the graph into two linear or 2nd degree polynomial
equations. The results
of this are shown in the attached table. As
can be seen, 2 linear expressions can approximate better than the single linear
expression, but still not as good as the 2nd degree polynomial.
|
Minutes |
Deg
F |
Linear |
Error |
2nd
Degree Poly |
Error |
|
0 |
212 |
212
|
0
|
212
|
0
|
|
1 |
205 |
208
|
3
|
207
|
2
|
|
2 |
201 |
204
|
3
|
203
|
2
|
|
3 |
193 |
200
|
7
|
198
|
5
|
|
4 |
189 |
196
|
7
|
194
|
5
|
|
5 |
184 |
192
|
8
|
189
|
5
|
|
6 |
181 |
188
|
7
|
185
|
4
|
|
7 |
178 |
184
|
6
|
181
|
3
|
|
8 |
172 |
180
|
8
|
178
|
6
|
|
9 |
170 |
176
|
6
|
174
|
4
|
|
10 |
167 |
172
|
5
|
170
|
3
|
|
11 |
163 |
167
|
4
|
167
|
4
|
|
12 |
161 |
163
|
2
|
164
|
3
|
|
13 |
159 |
159
|
0
|
161
|
2
|
|
14 |
155 |
155
|
0
|
158
|
3
|
|
15 |
153 |
151
|
2
|
155
|
2
|
|
16 |
152 |
147
|
5
|
152
|
0
|
|
|
|
|
65
|
|
51
|
|
|
|
|
|
|
|
|
Minutes |
Deg
F |
Linear |
Error |
2nd
Degree Poly |
Error |
|
15 |
153 |
153
|
0
|
153
|
0
|
|
16 |
152 |
152
|
0
|
152
|
0
|
|
17 |
150 |
150
|
0
|
150
|
0
|
|
18 |
149 |
149
|
0
|
149
|
0
|
|
19 |
147 |
147
|
0
|
148
|
1
|
|
20 |
145 |
146
|
1
|
146
|
1
|
|
21 |
143 |
144
|
1
|
145
|
2
|
|
22 |
141 |
143
|
2
|
143
|
2
|
|
23 |
140 |
141
|
1
|
142
|
2
|
|
24 |
139 |
140
|
1
|
140
|
1
|
|
25 |
137 |
138
|
1
|
139
|
2
|
|
26 |
135 |
137
|
2
|
137
|
2
|
|
27 |
133 |
136
|
3
|
136
|
3
|
|
28 |
132 |
134
|
2
|
134
|
2
|
|
29 |
131 |
133
|
2
|
132
|
1
|
|
30 |
130 |
131
|
1
|
131
|
1
|
|
|
|
|
18
|
|
21
|
|
|
|
|
83
|
|
72
|
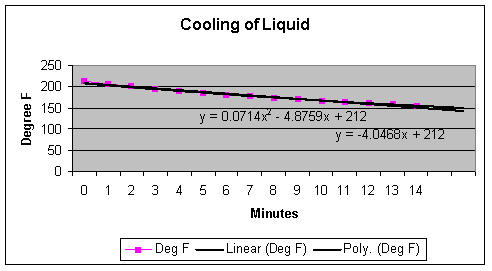
The
first of the two graphs below reflect the appropriate equations for the first
half of the recorded points. The
equations determined by the spreadsheet were:
Linear:
y = -4.0468x + 212
2nd
degree Polynomial: y = 0.0714x2
– 4.8759x + 212
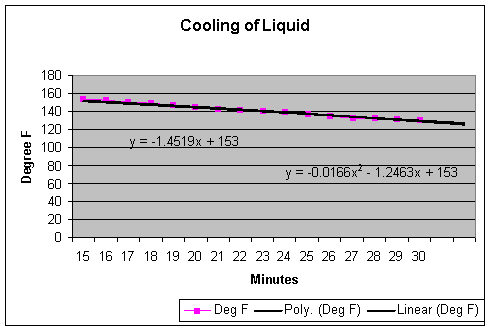
The
second graph reflect the equations for the 2nd half of the points. Please
note that the equations given by the spreadsheet tool reflect the time element
effectively beginning at 0 rather than at 15. The
equations effectively are:
Linear:
y = -1.4519(x-15) + 153
2nd
degree Polynomial: y = -0.0166(x-15)2 -1.2463(x-15) + 153
Some additional questions
may be asked – such as predicting when the liquid would cool to a specified
temperature – e.g. 100 def F or room temperature (75 deg F).
Each of the equations
derived from the plots can be investigated with various results. We
can either perform the calculation directly from the equation, or extend the
tables within the spreadsheet. The
single equation solutions, both linear and 2nd degree polynomial
yield less than desirable results:
|
|
Single
Equation |
Dual
Equation |
||
|
Minutes |
Linear |
2nd
Degree Poly |
Linear |
2nd
Degree Poly |
|
31 |
116
|
132
|
130
|
129
|
|
32 |
113
|
132
|
128
|
127
|
|
33 |
110
|
132
|
127
|
125
|
|
34 |
107
|
132
|
125
|
123
|
|
35 |
104
|
132
|
124
|
121
|
|
36 |
101
|
132
|
123
|
120
|
|
37 |
97
|
132
|
121
|
118
|
|
38 |
94
|
133
|
120
|
116
|
|
39 |
91
|
134
|
118
|
114
|
|
40 |
88
|
135
|
117
|
111
|
|
41 |
85
|
135
|
115
|
109
|
|
42 |
82
|
137
|
114
|
107
|
|
43 |
79
|
138
|
112
|
105
|
|
44 |
76
|
139
|
111
|
103
|
|
45 |
73
|
141
|
109
|
101
|
|
46 |
70
|
142
|
108
|
98
|
|
47 |
67
|
144
|
107
|
96
|
|
48 |
63
|
146
|
105
|
94
|
|
49 |
60
|
148
|
104
|
91
|
|
50 |
57
|
151
|
102
|
89
|
|
51 |
54
|
153
|
101
|
87
|
|
52 |
51
|
155
|
99
|
84
|
|
53 |
48
|
158
|
98
|
82
|
|
54 |
45
|
161
|
96
|
79
|
|
55 |
42
|
164
|
95
|
77
|
|
56 |
39
|
167
|
93
|
74
|
|
57 |
36
|
170
|
92
|
71
|
|
58 |
32
|
173
|
91
|
69
|
|
59 |
29
|
177
|
89
|
66
|
|
60 |
26
|
181
|
88
|
63
|
A graphic representation
follows:
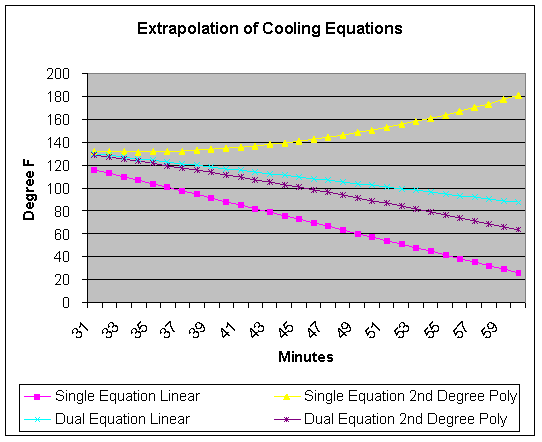
For the linear equation we
see that we reach 100 deg F in about 37 minutes and 75 deg F in about 45
minutes. This is not too surprising;
however, the equation yields temperatures below room temperature (actually below
freezing) within an hour. This
equation appears not to be a very good predictor.
It is important that this type of result be explained when presenting to
classes. Curve fitting techniques
are typically focused on discrete ranges. When
the ranges investigated exceed the range initially defined, then poor results
are possible.
This is further seen with
the 2nd degree polynomial expression. There
are no valid solutions for y = 100 or y = 75.
When we examine this with the spreadsheet, it is evident that the
temperature values extrapolated for later times, the temperature values begin to
rise. Again, this points out the
dangers in extrapolation of what appeared to be a valid representation of the
data between 0 and 30 minutes.
When we split the
equations for the first 15 minutes and the last 15 minutes, then we have better
results on the determination of time for 100 deg F and 75 deg F.
As can be seen, the results seem more realistic.
In the points of discussing this with a class, here it can be noted that
the other parameters that affect the change in temperature over time may be
necessary to better approximate the expected temperature over time. E.g
ambient temperature, thermal properties of the container.
A copy of the spreadsheet used for this example is provided at the following link. (Note: EXCEL Spreadsheet - Office 2000 Version)
Some additional spreadsheet examples are provided below:
Absolute Differences - 4 Numbers

