Let's see the graph of
when a=-2, -1.5, ..., 1.5, 2.
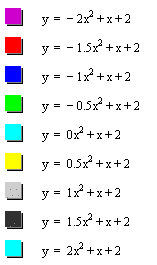
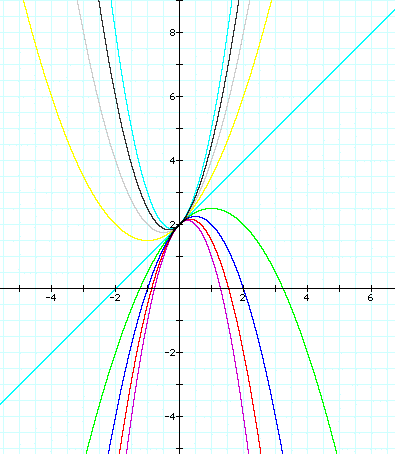
We can see that as a is varied, the width and vertex
of is varied but
all graph pass through (0,2).
Case 1) a>0
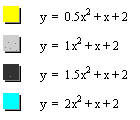
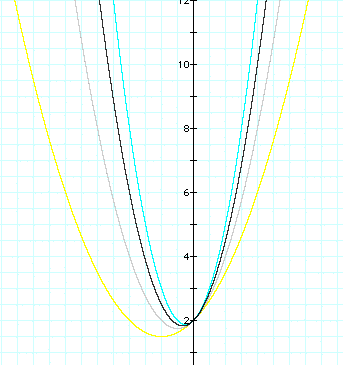
We can know that the width of the graph is gradually wider as a is close to zero and the verttices are on the left hand side of the y-axis
Case 2) a = 0
Our equation becomes a line
Case 3) a<0
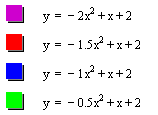
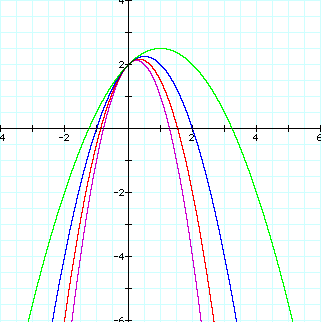
Likewise a>0, we can know that the width of the graph is gradually wider as a is close to zero and the verttices are on the right hand side of the y-axis
Our Result
1) As the value of a is close to zero, the width of the grapgh becomes wider
(i.e. as the absolut value of a is decreasing, the width of the grapgh becomes wider)
2) As the value of a is decreasing, the vertex moves towards left-down passing through (0,2)
3) All graph of the equation above pass through (0,2)
4) If a>0 then the grapgh is concave and if a<0 then the graph is convex
First, let's consider carefully the trace of the vertex of
Explore the trace
We can infer that a trace of the vertices becomes a line passing through (0,2)
Second, let's consider carefully the trace of the vertex of
Explore the trace
We can infer that a trace of the vertices becomes a parabola passing through (0,2)
Third, let's consider carefully the trace of the vertex of
Explore the trace
We can infer that a trace of the vertices becomes a line parallel to y-axis
Return to Hyungsook's homepage