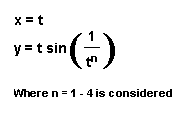
II. For the second part we will investigate the parametric curve
Assignment 10
Parametric Curves
by
Behnaz Rouhani
A parametric curve in the plane is a pair of functions
This assignment is divided into three parts:
I. First we will explore the equation

II. For the
second part we will investigate the parametric curve
for different values of a and b.
III. Special explorations
Case I: Let us explore the equation

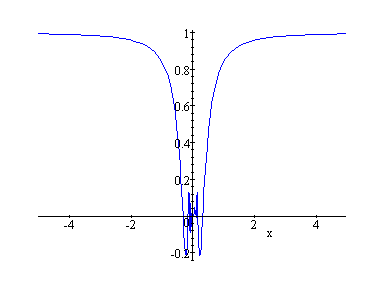
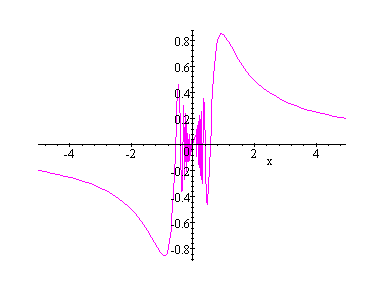
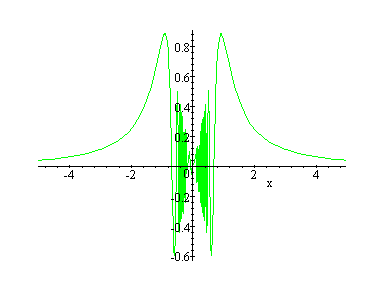
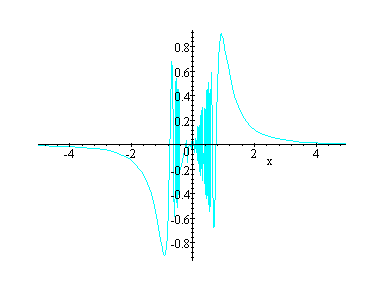
We will set to demonstrate what happens to the curve of the parametric equation as the exponent for t increases. While viewing the following curves do you see an interesting phenomenon?




x = cos (at)
y = sin (bt)
for different values of
a and b.
(cost, sin3t) ---- Green
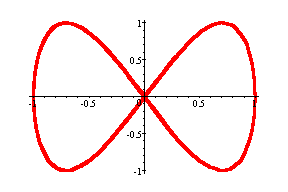
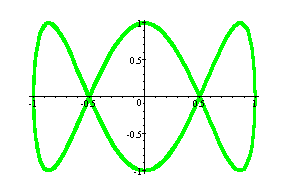
Observation: When a =1, the number of hoops is the
same as b.
(cos2t, sin 4t) --- magenta
(cos2t, sin8t) --- Navy blue
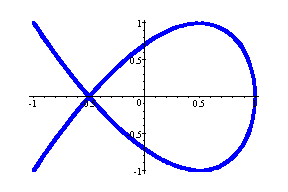
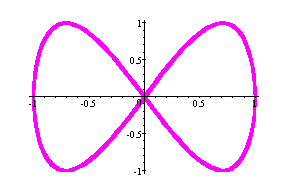
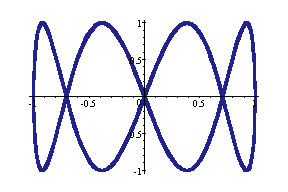
Observation: When a = 2, the number of hoops is the
same as b/2.
Part C: a < b, a =3
(cos3t, sin4t) --- Red
(cos3t, sin7t) ---- Magenta
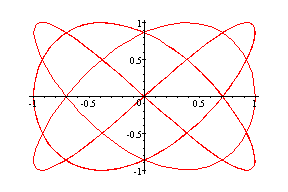
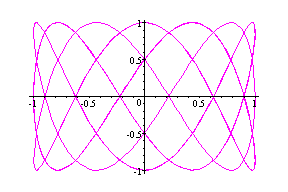
Observation: When a = 3, the number of hoops is the
same as b.
Part D: a < b, a = 4
(cos4t, sin6t) --- Green
(cos4t, sin8t) --- Yellow
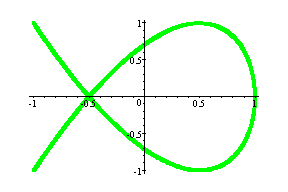
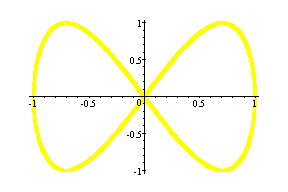
These graphs are similar to graphs of (cos2t, sin3t)
and (cos2t, sin4t) respectively. Can you tell why we get the same graphs?
Part E: a < b, a = even number
(cos4t, sin5t) --- Brown
(cos6t, sin7t) --- Green
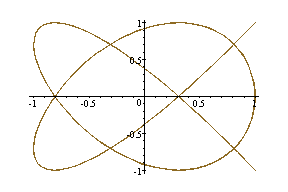
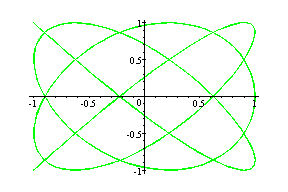
What kind of conjecture could we make about this case?
(cos10t, sin5t) ---- brown
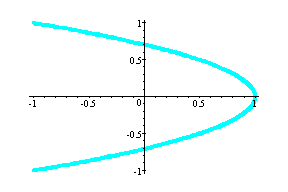
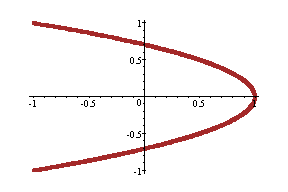
Observation: As long as coefficient of b is half
of a, the graph is a parabola with vertex at (1,0).
Part G: a > b, a = even number, b = odd number , difference between a and b is one
(cos4t, sin3t) --- cyan
(cos6t, sin5t) --- Brown
(cos14t, sin13t) --- Blue
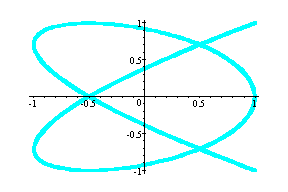
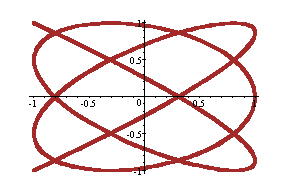
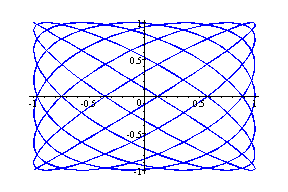
Observation: As the value of a and b increases, with a = even number, b = odd number and the difference between a and b is one, the graphs seem to be getting filled up.
Part H: a > b, a = odd number, b = even number, difference between and b is one
(cos3t, sin2t) --- Green
(cos5t, sin4t) --- Red
(cos7t, sin6t) --- Blue
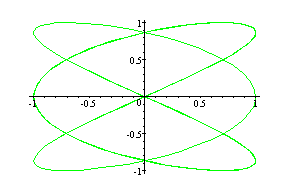
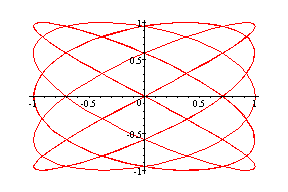
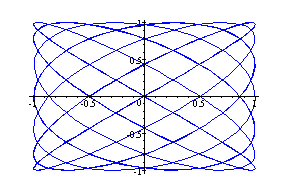
This interesting pattern occurs when simple curves are displayed as the "envelope" of a more complicated function. In practice such things happen when low frequency waves ride carrier waves broadcast from a radio station.
Notice the two blue graphs in part G and H, don't they look almost alike?
Part I: a > b, a =odd number, b = odd number, and difference between a and b is more than one
(cos7t, sin3t) --- Blue
(cos11t, sin3t) --- Green
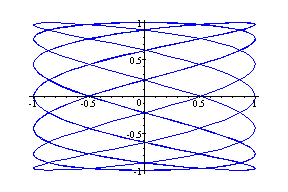
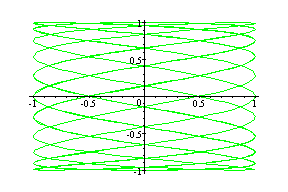
Observation: Number of hoops in each case is the same as a.
Case III: Special Investigations
We will try to explore the following special parametric curves.
Part A:

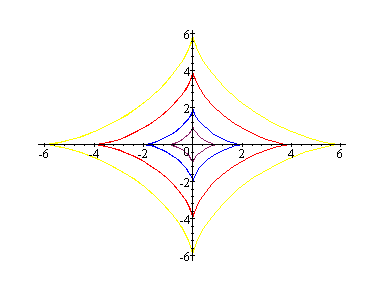
This is the graph of Astroid
for different values of a = b. Here is the color coding for the graph.
Maroon graph: a = b = 1
Blue graph: a = b = 2
Red graph: a = b = 4
Yellow graph a = b =
6
Part B:
( t - sint, 1 - cost)
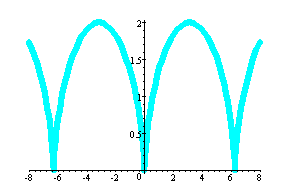
This is the graph of Cycloid.
Return to Behnaz Rouhani's page