Assignment 1: Linear Functions
by
Mike Cotton
In this assignment, a pair of linear functions f(x) & g(x) will be investigated under
addition, multiplication, division, and composition.
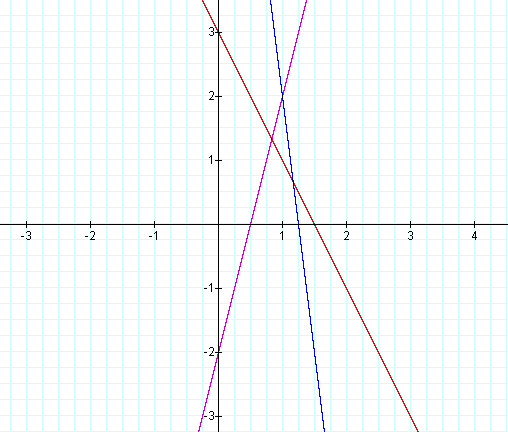
i. Addition


This graph was created by Graphing
Calculator 3.2.
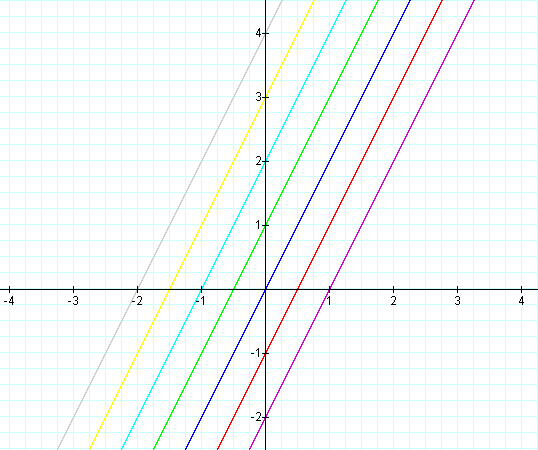
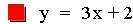
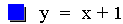
In this example of addition, the constant value in the first linear
function is varied from 3 to -3. Note that the sum of the individual
slopes is the resulting slope, and that the sum of the y-intercepts is
the resulting y-intercept [i.e. (ax + b) + (cx + d)=(a + c)x + (b +
d)]. The result of the addition of the
above functions is that the resulting slope remains constant, and the
y-intercept changes. The same result would occur if the constant value
in the second linear function is varied.
Another Addition example.


This graph was created by Graphing
Calculator 3.2.
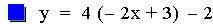
In this example of addition, the slope value in the first linear
function is varied from 4 to -2. Again, note that the sum of the
individual slopes is the resulting slope, and
that the sum of the y-intercepts is the resulting y-intercept [i.e. (ax
+ b) + (cx + d)=(a + c)x + (b + d)]. The result of the addition of the
above functions is that the resulting slope changes, and the
y-intercept remains constant. The same result would occur if the slope
value
in the second linear function is varied. Note that if the slope and
constant values are both varied, both the slope and the y-intercept
will vary.
ii. Multiplication


This graph was created by Graphing
Calculator 3.2.
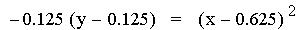
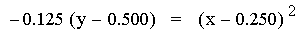
In this example of multiplication, the constant value of the first
linear function was varied from -3 to 1. The result of multiplying two
linear functions together is a quadratic equation. A quadratic equation
is a second-order polynomial equation in a single variable x,
which is generally of the form ax2+bx+c = 0. The
second representation of the equations above (after the multiplication)
is of the form 4p(y – k) =
(x - h)2, where h is the x-coordinate of the vertex
of the parabola, and k is the y-coordinate of the vertex. Therefore the
point V(h, k) is the vertex of each parabola. As you can see above this
point is different for each equation. Note that all of the parabolas
above are similar. This is because 4p = -0.125 (p = -0.03125) in all of
the equations. If p were positive the parabolas would open upwards.
Using the first equation above, it is worth pointing out that the
x-intercepts (roots) of the quadratic are the same as the x-intercepts
of the two original linear functions.


This graph was created by Graphing
Calculator 3.2.
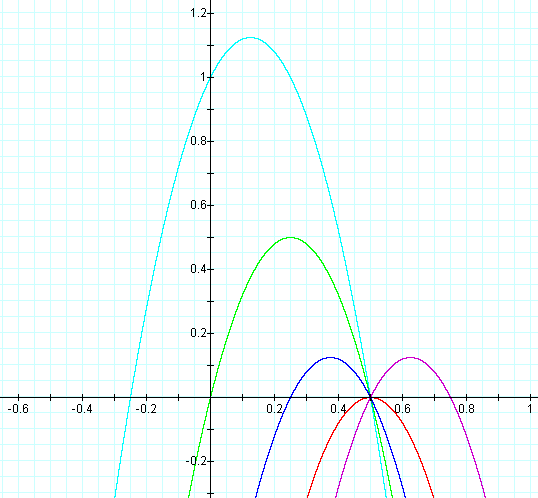
Another multiplication example


This graph was created by Graphing
Calculator 3.2.
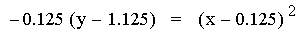
In this example of multiplication, the slope value in the second linear
function was varied from -3 to -1. Again, the result of multiplying two
linear functions together is a quadratic equation. The second
representation of the equations above (after the multiplication) is of
the form 4p(y
– k) = (x - h)2. Note that all of the parabolas above
are not similar. This is
because 4p a different value in all of the equations above. If p were
positive the parabolas would open upwards. Again, the x-intercepts
(roots) of the quadratic are the same as the x-intercepts of the two
original linear functions
iii.
Division


This graph was created by Graphing
Calculator 3.2.
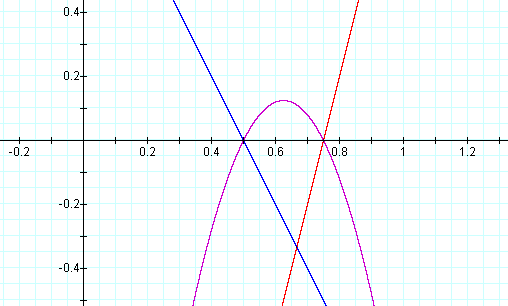
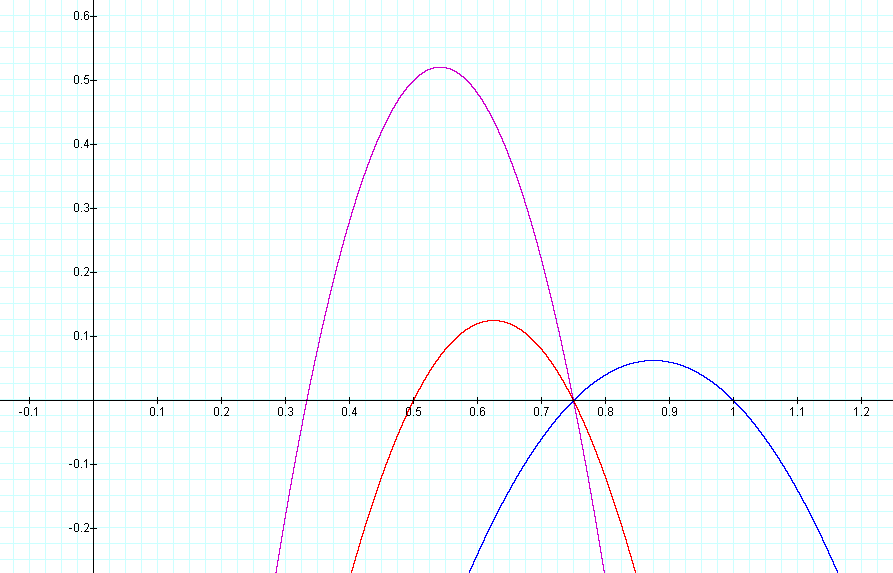
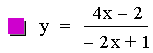
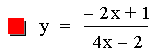
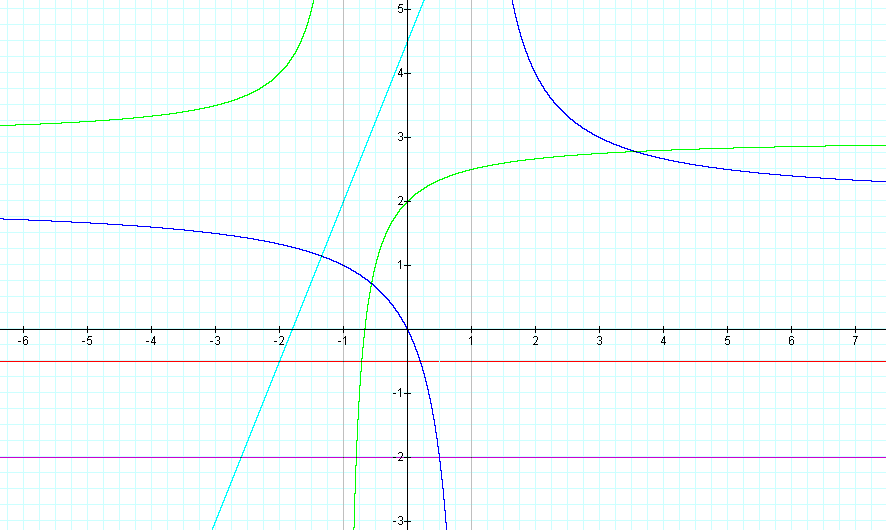
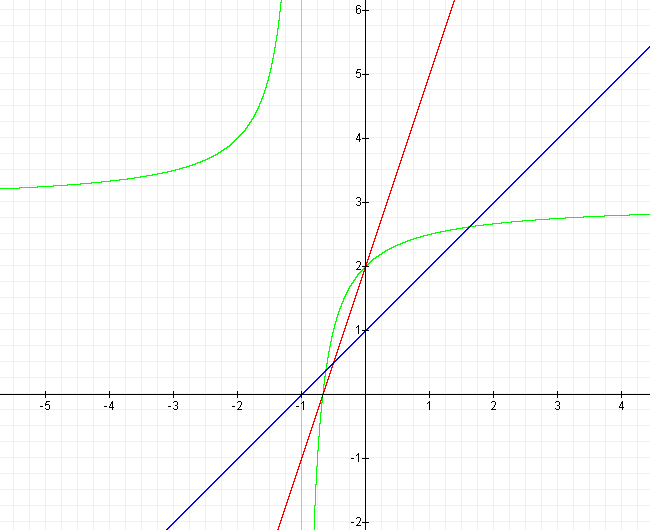
In this example of division of two linear functions, there are three
different results. The result of the division of the first two
equations (purple & red) is a constant. This is because the
numerator is a (constant) multiple of the denomerator. The next two
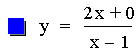
equations (blue & green) result in hyperbolas (described in more
detail below). The last equation (lite blue) results in a line with a
slope that is not equal to zero (i.e. y = ax + b).
This graph was created by Graphing
Calculator 3.2.
As mentioned above, one result of the division of the two linear
functions is a hyperbola. Notice that the vertical asymptote is the
value for x when the denomerator is set equal to zero, and that the
x-intercept of the hyperbola is the value for x when the numerator is
se equal to zero.
iv.
Composition


This graph was created by Graphing
Calculator 3.2.
The composition of two linear functions is expected to be of the form:
a(cx + d) + b = acx + (ad + b). This result is another linear function.
Student
Pages Return to main Page
Assignment 2